
Despite boasting the world’s 13th largest GDP, the growing Australian economy has not been gaining notoriety on the global stage for the right reasons.
Since the Paris Agreement, Australia’s efforts toward influencing climate change have come under intense criticism. The world’s leading liquid natural gas exporter and second-largest coal exporter isn’t letting go of fossil fuels as rapidly as many other developed nations.
Unambitious emissions targets have bogged down political action for years. As the world moves toward net zero, Australia’s insufficient emissions policy serves as a case study for the rest of the globe, bringing the Land Down Under to the bottom of CCPI’s rankings for climate action. Let’s explore some inside data with this look at CO2 and greenhouse gas emissions statistics in Australia.
Click below to jump ahead:

The 11 CO2 and Greenhouse Gas Emissions Statistics in Australia
- Australia’s CO2 emissions from fossil fuels and industrial purposes are nearly 2.5 times higher than they were 50 years ago.
- Australia’s CO2 emissions dropped by over 22 megatons from 2019 to 2020.
- Australia contributes roughly 1.1% of the world’s CO2 emissions.
- Australians produce over 15 tons of CO2 per capita.
- The mortality rate from air pollution is 71 per 1 million Australians.
- Electricity and heat production creates 35% of Australia’s GHG emissions.
- Coal produces roughly 160 million tons of CO2 each year.
- AGL Energy Limited produces 40 million tons of GHG emissions.
- Road vehicles are responsible for 13% of GHG emissions in Australia.
- Queensland generated over 159 megatons of CO2 in 2020.
- Tasmania offsets nearly 4 megatons of CO2.

Australia’s GHG Contributions
1. Australia’s CO2 emissions from fossil fuels and industrial purposes are nearly 2.5 times higher than they were 50 years ago.
(Statista)
Australia’s CO2 emissions have risen with the growth of its economy since the 1970s when industrial sources emitted 161.08 million metric tons of CO2.
After a steady rise over four decades, the nation’s CO2 emissions peaked at 413.04 million metric tons, more than 2.5 times the amount from 1970. Numbers declined until 2014 before rising again. In 2020, Australia emitted over 386 million metric tons of CO2 from fossil fuel and industrial activity.

2. Australia’s CO2 emissions dropped by over 22 megatons from 2019 to 2020.
(Our World in Data)
While 386 million tons of CO2 emissions isn’t boast-worthy, the relative change from the prior year was impressive. Australia shed 22.62 million tons of CO2 in 2020: the greatest GHG emissions drop in the country’s history, per numbers from Our World in Data.
Unfortunately, the historic drop isn’t likely to be indicative of a trend. Emissions from the transport sector plummeted in 2020, primarily due to COVID’s impact. Electricity generation continues to its steady downward trend in 2021, but as the world returns to normal, emissions from transport, stationary energy, agriculture, and industrial operations are back on the rise in Australia.
3. Australia contributes roughly 1.1% of the world’s CO2 emissions.
(Our World in Data)
The bigger the economy, the greater the effect on the planet. While Australia is poised to become the 12th largest economy in the world, it’s nowhere close to the top contributors in terms of GDP or CO2 emissions.
In 2020, Australia accounted for only 1.13% of the global CO2 emissions, a far cry from China’s world-leading 30.65% share and America’s second-place 13.54% share. Australia’s share has been dropping steadily since 2016 and shows a drastic improvement over its two-decade high of 1.42% in 2001.
Australia’s Emissions and the Population
4. Australians produce over 15 tons of CO2 per capita.
(Our World in Data)
With only 1.13% of emissions coming from Australia, it may seem like it’s not any worse than the largest economies in the world. But from a per capita basis, Australia leads the world in the worst way possible.
Australia is incredibly sparse. Despite being over 76 times larger than South Korea, it has less than half the population size, an important consideration when giving them credit for CO2 emissions. In 2020, Australians produced 15.37 tons of CO2, more than the per capita rate of many developed nations, including the United States, South Korea, Japan, China, and India.
5. The mortality rate from air pollution is 71 per 1 million Australians.
(OECD)
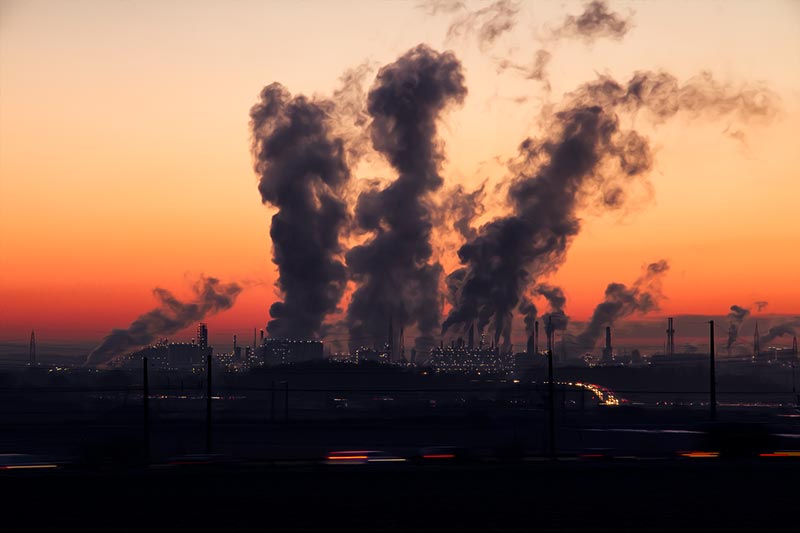
Despite its relatively high emissions, Australia still posts remarkable air pollution numbers. Australia’s essential air quality concerns include PM2.5 (particulate matter under 2.5 microns) and ozone, two primary contributors to respiratory diseases in the country.
Air pollution is responsible for 70.73 deaths for every 1 million inhabitants in Australia. It has a lower mortality rate than nearly every country that beats it in outright emissions, including Norway (73 deaths per million), Switzerland (160 deaths), and France (203 deaths).
Given the heavy reliance on fossil fuel burning, a unique susceptibility to bushfires and dust storms, and slow adoption of green technology, the fact that Australia outpaces nearly the entire world in reducing air pollution mortality rates is all the more surprising and impressive.

Australia’s GHG Sources
6. Electricity and heat production creates 35% of Australia’s GHG emissions.
(Our World in Data)
Energy contributes more to Australia’s GHG emissions than any other sector. Electricity and heat production accounted for more than 1/3rd of the country’s emissions, reaching 222 million tons in 2019. According to Our World in Data, that was nearly 100 million more tons than the next highest sector, agriculture.
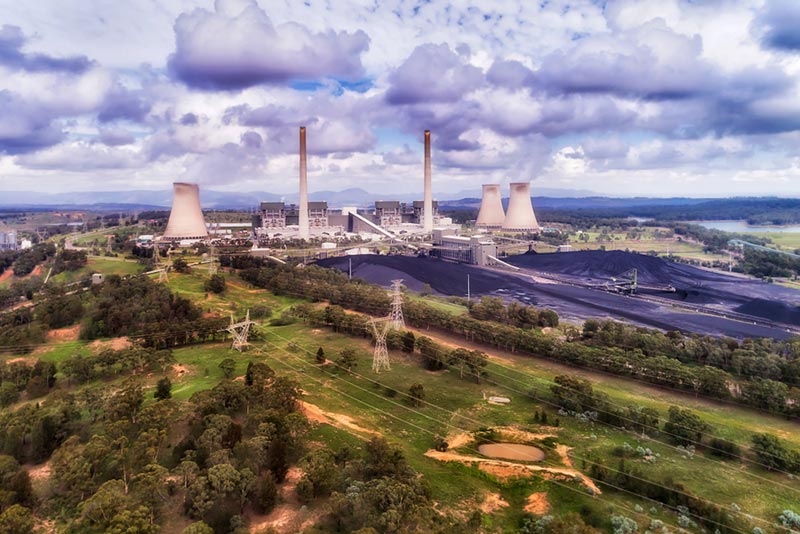
7. Coal produced roughly 160 million tons of CO2 in 2020.
(Our World in Data)
Australia supplied approximately 58% of its electricity demand with coal-driven power in 2019, more than double the OECD average. It’s no surprise that coal contributes the most to the country’s CO2 emissions, accounting for 159.82 million tons. Oil was the second-highest CO2-producing fuel at 124.61 million tons.
Fossil fuel dependency is going down, and despite a slight uptick from 2014–2016, coal use is back on a downward pace, posting much better results than its all-time high of 207.42 million tons in 2008.
Australia is bringing fossil fuel numbers down by picking up its solar and wind energy investments. According to Ember, the country increased its wind and solar share by 9%, raising it from providing 13% of Australia’s electricity demand to 22% between 2019 and 2021. With 12% of its electricity being solar-generated, the country has the highest percentage of its power share coming from solar of any country in the world.

8. AGL Energy Limited produces 40 million tons of GHG emissions.
(Clean Energy Regulator)
Unsurprisingly, Australia’s number one carbon emitter is its leading coal generator.
AGL Energy, based out of Sydney, supplies 2.1 million households in Australia with electricity, taking 21% of all residential customers, according to 2020–2021 numbers. That year, AGL also provided 40.2 million tons of scope 1 carbon emissions, more than double that of the next highest emitter, EnergyAustralia Holdings Limited.
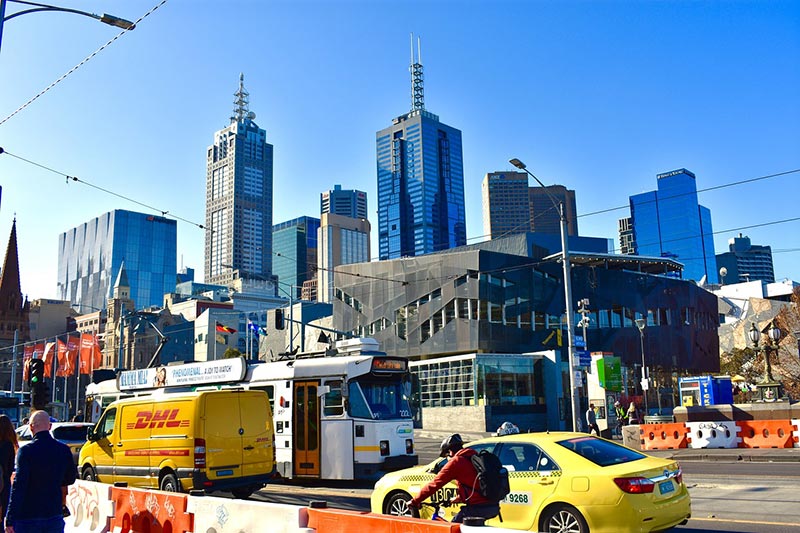
9. Road vehicles are responsible for 13% of GHG emissions in Australia.
(BITRE)
The transport sector continues producing more CO2 every year, even as other sectors are leveling off or dropping. Transport was responsible for 102.04 million tons of GHG emissions in 2019, and road vehicles chipped in nearly 80 million tons. It was an emissions reduction for the sector from the prior two years but likely only a temporary symptom of COVID. CO2 emissions jumped back above 80 million tons in 2020–2021.
Australia’s cars and light commercial vehicles produce over 63% of the country’s transport-related emissions, even when accounting for rail, ship, and aviation. Many point to the slow adoption of public transit and minimal investments in walk/bike paths to explain why the country continues to be so dependent on cars.
10. Queensland generated over 159 megatons of CO2 in 2020.
(Greenhouse Accounts)
Queensland is more dependent on coal than any other Australian state, containing eight of the country’s 16 coal-fired power production plants, including the Stanwell and Taron station, which is responsible for 50% of the state’s coal-fired electricity generation. In 2020-2021, the state released 159.2 million tons of GHG emissions, accounting for 29.1% of the country’s total emissions.
11. Tasmania offsets nearly four million tons of CO2.
(Greenhouse Accounts)
While Queensland is leading in emissions, Tasmania is setting a more positive example for the country and heading the charge to achieve net zero. The island state of roughly 550,000 inhabitants has had net negative emissions since 2014, offsetting 3.7 million tons of GHG emissions. It is the third place to reach carbon neutrality, following Bhutan and Suriname.
Forest management is the primary cause of Tasmania’s improvement in net emissions. After relying heavily on pulp production for paper, Tasmania cut its logging activities and transitioned to more sustainable practices in the early 2010s. Young forests began regrowing, and carbon absorption increased.
Tasmania still produces roughly 8 million tons of CO2 emissions through energy production, transport, agriculture, and industry. But considering land use, land use change, and forestry (LULUCF), which pulls more than 11 million tons of atmospheric CO2, the island arrives at a net negative.
Is it sustainable? Many argue that it isn’t, as aging trees will absorb less and less CO2 over time. Maintaining a net negative will require more forest growth or reduced emissions elsewhere. Alternative energy appears to be the way forward, as over 50% of the island is already forested.

Frequently Asked Questions
How Is Australia Reducing CO2 Emissions?
Australia has developed a reputation as a laggard in cutting CO2 emissions. For years, the government has faced the challenge of balancing pro-climate party demands and the needs of the coal and gas industry, the backbone of the nation’s export economy and energy production.
As a result, the government created lax initiatives like the safeguard mechanism, which set easily achievable emissions baselines. Loose laws acknowledged climate change without creating notable expectations or inspiring genuine efforts to cut emissions.
After more than a decade without meaningful reform, the recently established Albanese government set clear standards through its Climate Change Bill 2022. Industries face new requirements to cut carbon emissions by 43% by 2030 and achieve the net zero target by 2050 as part of their commitment to the Paris Agreement. Still, the government is taking a moderate stance, as evidenced by the approval of new oil drilling and coal mining ventures.
(Prime Minister of Australia)
Are Australians Adopting Electric Vehicles?
EV adoption has historically been a red mark against Australia, but positive change is starting to take place. Battery electric vehicles (BEVs) accounted for 2% of new vehicle sales in 2022, up nearly 1 percentage point from 2 years prior.
Australians overwhelmingly desire climate change action. The slow uptake of EVs isn’t due to buyer apathy but rather availability. Plug-in hybrid EVs (PHEVs) are more widely available than BEVs, and those available are fairly expensive. BMW and Mercedes Benz offered the widest selection of BEVs in the country as of 2021.
Unfortunately, there’s little incentive for EV manufacturers or consumers in Australia, slowing the sector’s growth. By comparison, Norway slashed taxes and fees on new EV sales to encourage adoption, causing many EV prices to fall below their ICE equivalents. The result? Norway started 2022 with EVs accounting for nearly 84% of all new vehicle sales in January.
Fortunately, the Labor government is beginning to deliver on the campaign promises to increase EV adoption that helped it win the 2022 election. Lawmakers submitted proposals in July seeking to drop import duties and reduce sales taxes and fees, giving manufacturers more reason to supply EVs and buyers more incentive to purchase them.
(The Driven) (Electric Vehicle Council) (ABC)

How Much CO2 Do Australian Bushfires Produce?
The human factor takes most of the attention in Australia, but emissions also stem from its unique environment. Australia faces a higher threat of forest fires than any other country. Bushfires are a continuing battle. Drought and heat, spurred on by climate change, create the perfect setting for the 45,000–60,000 wildfires that happen every year.
The 2019-2020 summer, dubbed “Black Summer,” is the quintessential example of Australian bushfires’ devastating impact. As they burned over 24 million hectares (59 million acres), claiming the lives of 34 people and over 3 billion animals, the fires from November 2019 to January 2020 produced over 700 million tons of carbon dioxide, nearly 300 million more tons of CO2 than the country’s human-generated emissions.
Short-term PM2.5 concentration from the fires caused 171 deaths. In total, smoke inhalation caused nearly 450 deaths and affected 80% of the Australian population.
(The Conversation) (Nature) (Britannica) (EOS) (ABC)
Conclusion
Australians want change. Labor’s 2022 victory shows they’re fed up with vague promises and underwhelming goals, and that sentiment is going beyond the government and entering the board room.
Wealthy activists are speeding up climate action. In 2011, Graeme Wood and Jan Cameron bought the world’s largest woodchip mill, located in Tasmania, only to shut it down. Eleven years later, billionaire Mike Cannon-Brookes, primary shareholder at AGL Energy, used his leverage to redirect the country’s biggest polluter toward green energy. Change is on the horizon in Australia. After over a decade of inaction, Australians seem ready for it.
Featured Image Credit: Taras Vyshnya, Shutterstock
Contents