

Note: This article’s statistics come from third-party sources and do not represent the opinions of this website.
Uber and Lyft, among smaller rideshare companies, have drastically changed the way we get from place to place. Some people hate them, while many people love their unparalleled convenience. However, Ubers and Lyfts get into accidents sometimes, too, just like us. Let’s check out some more detailed statistics about rideshare accidents below.
Click below to jump ahead:
- Effects of Uber and Lyft on Road Fatalities
- Rideshare Fatality Statistics
- Rideshare Industry Statistics

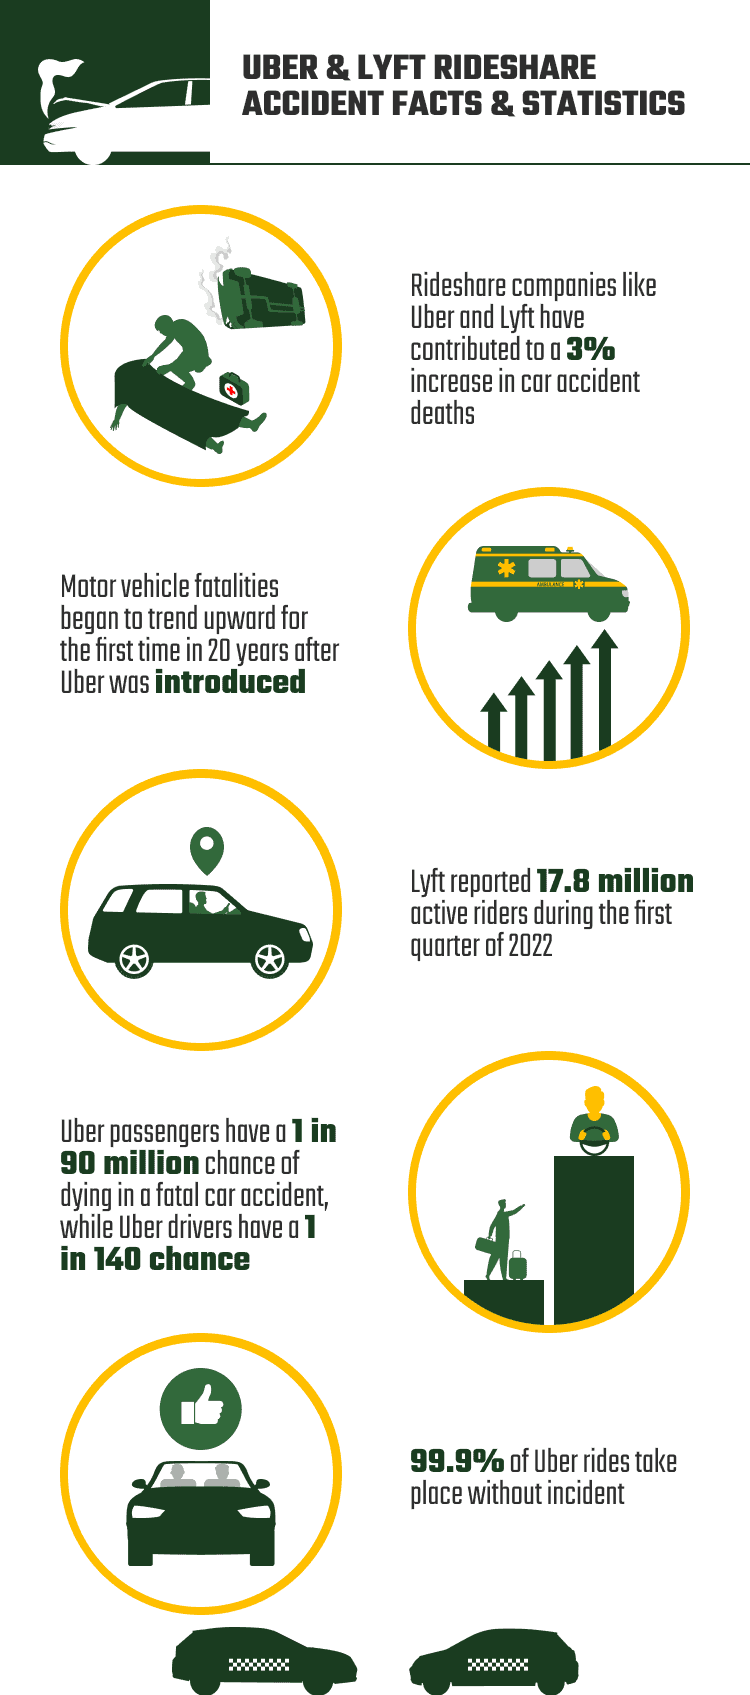
- Rideshare companies like Uber and Lyft have contributed to a 3% increase in car accident deaths.
- After Uber was introduced in 2010, drunk driving arrest rates fell 15%–62%, depending on the city.
- After Uber was introduced, motor vehicle fatalities began to trend upward for the first time in 20 years.
- Increasing numbers of rideshare vehicles are estimated to cause about 1,000 accident fatalities per day.
- Uber passengers have a 1 in 90 million chance of dying in a fatal car accident.
- Uber drivers have a 1 in 140 chance of dying in a fatal car accident.
- In 2020, fatal car crashes, including rideshare vehicles, rose significantly.
- Lyft reported 17.8 million active riders during the first quarter of 2022.
- Uber reported 115 million monthly users during the first quarter of 2022 in contrast to 98 million during the first quarter of 2021.
- 99.9% of Uber rides take place without incident.
- 3,824 sexual assaults were reported in Uber vehicles in 2019 and 2020.
Effects of Uber and Lyft on Road Fatalities
(National Bureau of Economic Research)
This number may seem shocking at first glance, but it’s actually on par with road fatalities in general. The main caveat is weekend and night fatalities. During those times, car-related fatalities (including rideshare cars) increased by up to 4%. While small, this checks out considering how many people use rideshares in the evening.
2. After Uber was introduced in 2010, drunk driving arrest rates fell 15%–62% percent, depending on the city.
(Providence College)
One of the more positive impacts Uber and Lyft have had is on drunk driving rates. After 2010, people were arrested for drunk driving at a much lower rate than before. The convenience of hailing a rideshare seems to heavily outweigh the risks of driving while drunk. Many of the earliest studies on rideshare companies were focused on this topic, but later studies have been more focused on accidents and other sexual assaults.
3. After Uber was introduced, motor vehicle fatalities began to trend upward for the first time in 20 years.
(Booth School of Business)
It only makes sense that with more cars on the road, accidents and fatalities would increase. Companies like Uber and Lyft rely on having lots of drivers on the road at all times so they can get to passengers quickly, which jams roadways and makes accidents more likely. Though, it can be hard to tell exactly how much of an effect rideshare companies, in particular, are having.
(National Bureau of Economic Research)
According to the average rate of accident growth, rideshare vehicles directly contribute to around 1,000 deaths per day. Considering that there are roughly 37,000 fatalities per day already, that’s a remarkable uptick. This rises at night and on weekends, and more people tend to die in cities than in rural areas.
5. Uber passengers have a 1 in 90 million chance of dying in a fatal car accident.
(Uber Safety Report)
Passengers are typically more at risk of dying in an accident, especially backseat passengers. This is usually attributed to the lack of airbags in the back seat, as well as passengers simply not buckling their seat belts. Regardless, 1 in 90 million seems like a statistically insignificant risk when most people already have a 1 in 107 chance of dying in a car crash during their lifetime.
6. Uber drivers have a 1 in 140 million chance of dying in a fatal car accident.
(Uber Safety Report)
It’s important to note here that Uber drivers are killed far less frequently than passengers, which may be due to safety features like airbags or safe driving habits developed during the course of their job. It’s an interesting stat considering that front-seat passengers are usually safer than drivers in accidents. We’re sure future studies will clarify this, but as of now, it remains a mystery.
(National Highway Traffic Safety Administration)
As the roads emptied during the COVID-19 pandemic, many experts believe that speeding and unsafe driving habits were the main contributors to a big spike in car accident fatalities. Deaths in Uber vehicles weren’t exempt, either, and Uber vehicles saw more fatalities than in previous years. Apparently, empty roads tempt drivers into driving too fast, which makes you more likely to get involved in an accident.
8. Lyft reported 17.8 million active riders during the first quarter of 2022.
(Uber Safety Report)
As one of the two biggest rideshare companies, Lyft is reporting its highest numbers since the pandemic began. They’re still way behind Uber, which largely dominates the sector. On average, Lyft only receives about 30% of the traffic that Uber does. They’re simply not present in as many locations, and prospective riders may prefer Uber. It’s not clear whether you’re more at risk in, say, an Uber versus a Lyft.

9. Uber reported 115 million monthly users during the first quarter of 2022 in contrast to 98 million during the first quarter of 2021.
(Uber)
Uber is doing very well, with more riders now than throughout the entire COVID-19 pandemic. They have several times the traffic that Lyft does, which isn’t surprising considering that Uber accounts for about 80% of the rideshare business. As with Lyft, we should only expect this number to swell in the future. This also means we’ll be seeing more deaths.
10. 99.9% of Uber rides take place without incident.
(Uber Safety Report)
This seems to be an impressive figure already, but it gets more impressive when you realize it includes sexual assaults and accidents. The company estimates that only 0.0002% of all rides are considered “critical safety incidents.” However, this figure does not include injuries or UberEats food deliveries. Those numbers would probably have a significant impact on the reported stats, but it’s impossible to tell.
11. 3,824 sexual assaults were reported in Uber vehicles in 2019 and 2020.
(New York Times)
It’s startling to consider that thousands of people have been assaulted in Ubers, but the good news is that this is actually a sharp reduction since their last safety report. From 2017 to 2018, there were 5,981 sexual assaults reported in Uber vehicles. Note that this stat doesn’t distinguish who the aggressors were—it includes passenger-on-passenger violence, passenger-on-driver violence, and driver-on-passenger violence.
 Frequently Asked Questions About Uber and Lyft Rideshare Accidents

- How do I report an accident as an Uber or Lyft passenger? – Both Uber and Lyft recommend calling 911 immediately after an accident and contacting their respective customer service teams afterward to report the incident. Depending on the severity of damage and your state’s at-fault/no-fault laws, you’ll be contacted to follow up on the accident and what consequences may ensue. We strongly encourage you to document your accident as much as possible. Filming is the best, but any method of documentation should work.
- Do I need special insurance to drive for Uber or Lyft? – Uber provides insurance that covers you while you’re driving for them, while Lyft does not. In either case, you can (or may be legally required to) purchase rideshare insurance to protect yourself from financial and medical liability in the event of an accident. Check out your state’s laws and the specific requirements of Uber and Lyft to be sure.
- Who is at fault if I’m hit by an Uber driver? – First responders will typically gather all relevant information from you and the other party after an accident, and you should report the accident to Uber immediately after via their customer support option on the app. You’ll be contacted by them at a later time to follow up, if necessary. Who exactly is at fault depends on whether your state is an at-fault or a no-fault state. In the former, the Uber driver would be liable, and Uber would pay for damages and medical bills. In the latter, your insurance would kick in.
Conclusion
Uber and Lyft are supremely convenient alternatives to public transportation and driving, but they are not without their risks. People die in accidents riding in Ubers every day, but generally, the risk is low. Statistically, you’re more at risk of dying in an accident by driving yourself. However, it’s crucial to be aware of the risks that rideshare companies present.
Featured Image Credit: Magsi, Shutterstock
Contents
