
Note: This article’s statistics come from third-party sources and do not represent the opinions of this website.
The ride-sharing industry has exploded in popularity in recent years. This relatively new industry has created a number of new opportunities for people looking to make money by driving others around.
This simple concept has allowed people to use their personal vehicles to generate income, and it has also given rise to a number of new businesses that have been built around this model.
The most popular ride-sharing companies are Uber and Lyft, but there are many other smaller companies that are operating in this space, as well. The basic premise of ride-sharing is simple—people use a smartphone app to request a ride, and then a driver picks them up and takes them to their destination.
The driver is usually a regular person who is using their personal vehicle to give rides, and they are typically paid by the ride-sharing company based on a combination of the time and distance of the trip.
Not only has ride-sharing posed a major threat to the taxi industry, but it’s got the numbers to back up its success—and potential for continued growth.
Click below to jump ahead:
- Global Ride-Sharing Statistics
- United States Ride-Sharing Statistics
- Income and Spending Ride-Sharing Industry Statistics

The 20 Ride-Sharing Statistics
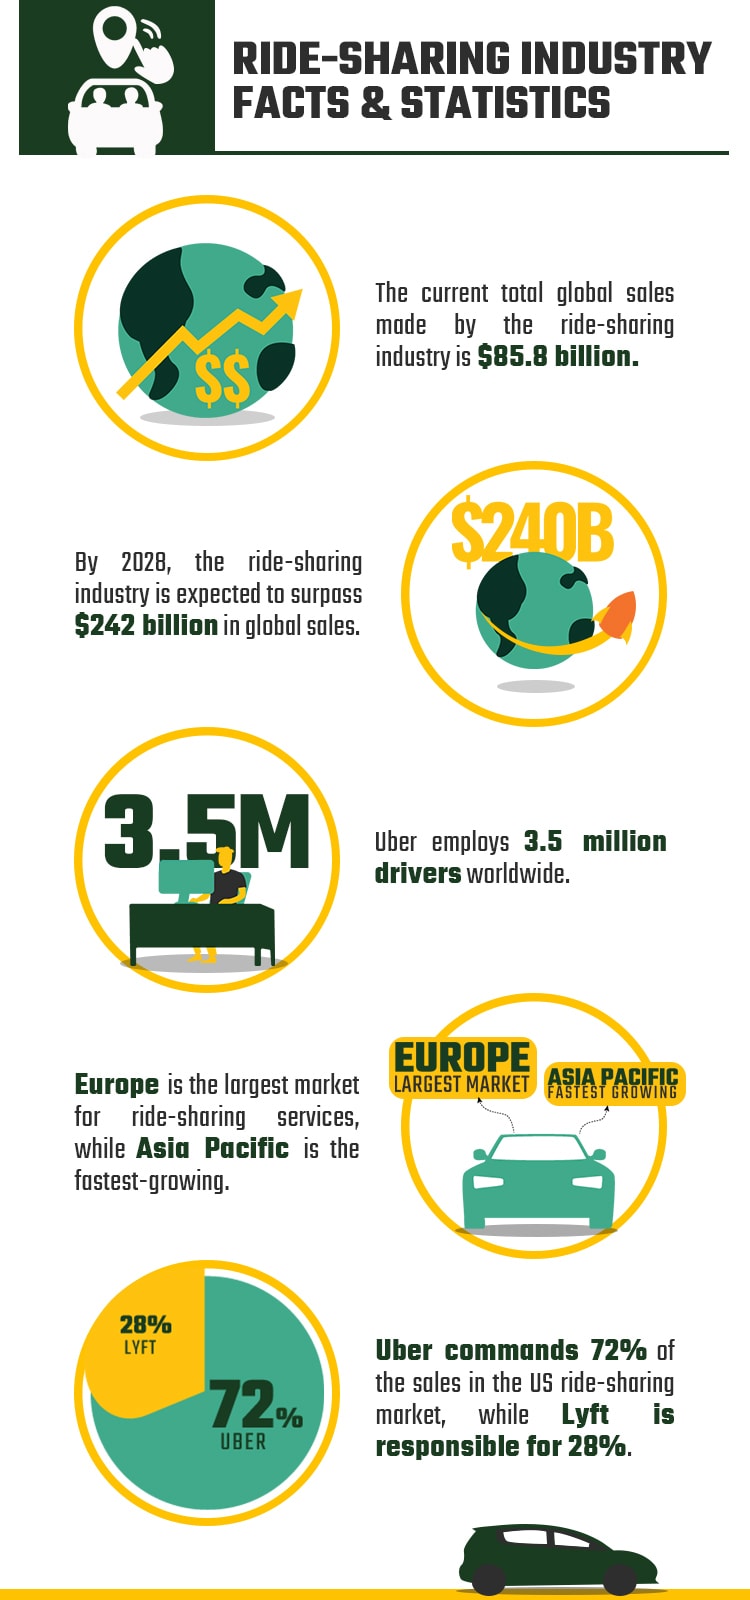
- The current total global sales made by the ride-sharing industry is $85.8 billion.
- Global sales are projected to reach $90.48 billion by the end of 2022.
- By 2028, the ride-sharing industry is expected to surpass $242 billion in global sales.
- Uber employs 3.5 million drivers worldwide.
- Europe is the largest market for ride-sharing services, while Asia Pacific is the fastest-growing.
- An estimated 14 million Uber rides are taken every day worldwide.
- Uber commands 72% of the sales in the U.S. ride-sharing market.
- In the United States, the ride-sharing industry’s total revenue was $7.14 billion in 2021.
- Lyft is responsible for 28% of the sales in the U.S. ride-sharing market.
- Of the United States’ 329.5 million people, more than 118 million use ride-sharing services, or 36%.
- General awareness of ride-sharing has exploded in recent years, jumping from 67% of the American population in 2015 to 97% in 2022.
- Out of all miles traveled via vehicle in the United States, Uber and Lyft make up 7%.
- In some U.S. cities, ride-sharing accounts for 14% of total vehicle miles traveled.
- Uber alone generates 93 million users per month.
- In 2022, the average Uber sale per customer is $87.
- Compared to Lyft, Uber averages 12% more income per customer.
- On average, Uber drivers in 2022 earn a monthly income of $450.
- In bigger cities, Uber drivers that work 10+ hours a day can earn $500 per day.
- As of 2022, Uber has a total market cap of $55.58 billion.
- Lyft has a market cap of $4.41 billion in 2022.
Global Ride-Sharing Statistics
1. The current total global sales made by the ride-sharing industry is $85.8 billion.
(Statista)
The rise in revenue has skyrocketed compared to just a few years ago. In 2014, Uber netted $495 million in revenue. Today, the ride-sharing industry brings in nearly $86 billion annually. That number is expected to continue to grow in the coming years.

2. Global sales are projected to reach $90.48 billion by the end of 2022.
(Statista)
The ride-sharing industry is rapidly growing all over the world. By the end of the year, ride-sharing is expected to increase 2021’s closing revenue of $85.8 billion to more than $90 billion.
3. By 2028, the ride-sharing industry is expected to surpass $242 billion in global sales.
(Fortune Business Insights)
The ride-sharing industry is expected to grow at a compound annual growth rate (CAGR) of 16.3% and reach $242.73 billion by 2028.
4. Uber employs 3.5 million drivers worldwide.
(Backlinko)
Uber’s driver base continues to grow to support the increasing number of riders using the app. With 3.5 million active Uber drivers globally, the company is continuing to invest in its driver community.
5. Europe is the largest market for ride-sharing services, while Asia Pacific is the fastest-growing.
(Mordor Intelligence)
Ride-sharing services have become increasingly popular in recent years as a convenient and affordable alternative to traditional taxi and public transportation options. The industry has seen rapid growth in both developed and emerging markets, with Europe and Asia Pacific being the largest and fastest-growing regions, respectively.
6. An estimated 14 million Uber rides are taken every day worldwide.
(Ridester)
Uber controls the majority of global ride-shares per day, with approximately 14 million rides. Lyft, the second largest ride-sharing service provider, has an estimated 1 million daily rides.
United States Ride-Sharing Statistics
7. Uber commands 72% of the sales in the U.S. ride-sharing market.
(Second Measure)
As of 2022, Uber’s sales in the United States account for 72% of the total ride-sharing market.
8. In the United States, the ride-sharing industry’s total revenue was $7.14 billion in 2021.
(Globe News Wire)
Ride-sharing is big business around the world, and the U.S. makes up a significant percentage of its total sales. By the end of 2021, the U.S. was responsible for more than $7 billion in sales, and that number is expected to grow in the years to follow.
9. Lyft is responsible for 28% of the sales in the U.S. ride-sharing market.
(Second Measure)
Lyft, the second largest player in the U.S. market, only has a 28% share of sales.

10. Of the United States’ 329.5 million people, more than 118 million use ride-sharing services, or 36%.
(Zippia)
A large percentage of the U.S. population uses ride-sharing services, which has grown rapidly in recent years. With more than a third of the population using these services, significant changes have occurred in the transportation industry.
11. General awareness of ride-sharing has exploded in recent years, jumping from 67% of the American population in 2015 to 97% in 2022.
(Policy Advice)
Compared to just a few years ago, most people know about ride-sharing. From 2015 to 2022, the general awareness of these services increased by 30%.

12. Out of all miles traveled via vehicle in the United States, Uber and Lyft make up 7%.
(WAMU)
Research shows just how often ride-sharing services are used. Between the two industry leaders, Uber and Lyft, ride-sharing accounts for 7% of all miles traveled in the U.S.
13. In some U.S. cities, ride-sharing accounts for 14% of total vehicle miles traveled.
(The Verge)
Already accounting for a considerable portion of daily miles traveled, Uber and Lyft control an even larger share when broken down to a per-city basis.
14. Uber alone generates 93 million users per month.
(Backlinko)
As the industry leader in ride-shares, Uber generates an estimated 93 million users per month. That’s more than three times the population of Australia! And they are just one company in a booming industry.
Income and Spending Ride-Sharing Industry Statistics
15. In 2022, the average Uber sale per customer is $87.
(Second Measure)
Just last year, the average Uber sale per customer was around $72. So in less than a year’s time, customers are paying approximately $15 more per ride.
16. Compared to Lyft, Uber averages 12% more income per customer.
(Second Measure)
Of the average customer charge of $87, Uber earns approximately 12% more than what the average Lyft user pays.
17. On average, Uber drivers in 2022 earn a monthly income of $450.
(Gridwise)
While not all Uber drivers work the same schedule, the average driver in the United States works about 30 hours per week. The median hourly earnings for Uber drivers in the United States comes out to around $15, which equals a monthly income of about $450 before taxes and expenses.
18. In bigger cities, Uber drivers that work 10+ hours a day can earn $500 per day.
(GOBankingRates)
Where an Uber driver works can make all the difference in how much they earn. Drivers in bigger, busier cities like New York, Los Angeles, and San Francisco can make significantly more money than drivers in smaller cities. In fact, an Uber driver in New York that works 10 or more hours a day can earn up to $500 per day.
19. As of 2022, Uber has a total market cap of $55.58 billion.
(Forbes)
Uber’s income has increased exponentially in recent years. By comparison, Uber made just over $2.1 billion in 2015. Today, the company’s market cap exceeds $55.5 billion and is projected to increase further in the years to follow.
20. Lyft has a market cap of $4.41 billion in 2022.
(Yahoo! Finance)
As the second-largest ride-sharing service, Lyft earns only a fraction of Uber’s market share. However, this number is up considerably compared to Lyft’s 2015 market share of just $130 million.
Frequently Asked Questions
What is the average cost of a ride?
The average cost of a ride will depend on the specific company you use, as well as the city you are in. However, rides typically range from $1 to $2 per mile. (Ridester)
How do I know if a driver is safe?
When choosing a ride-sharing company, be sure to read customer reviews to get an idea of the quality of service. In addition, all ride-sharing drivers must undergo a background check before they’re able to start driving. (Uber)

What if I need to cancel my ride?
If you need to cancel your ride, most companies will allow you to do so with no fee as long as you cancel at least 5 minutes before your scheduled pickup time. (Business Insider)
What if something goes wrong during my ride?
All ride-sharing companies have a customer service number you can call if you experience any problems during your ride. In addition, most companies also have a money-back guarantee in case you are not satisfied with your experience. (Lyft)
Is there a limit to how far I can go?
Not typically. Uber, for example, pays its drivers by the mile. Therefore, you can travel as far as the driver is willing to take you. (Ridester)

How do I pay for my ride?
Ride-sharing companies typically use a credit or debit card payment system. When you sign up for an account, you will be asked to enter your payment information. Your fare will then be charged to your card automatically after each ride. (Uber)
Conclusion
Ride-sharing is only expected to grow in popularity in the coming years. If the current trend continues, Uber will likely remain the dominant player in the market. However, other companies are quickly catching up, so the competition is heating up.
For consumers, this means more choices and lower prices. So whether you’re looking for a cheap way to get around town or you need a safe ride home after a night out, ride-sharing is worth considering.
Featured Image Credit By: why kei, Unsplash
Contents