

Note: This article’s statistics come from third-party sources and do not represent the opinions of this website.
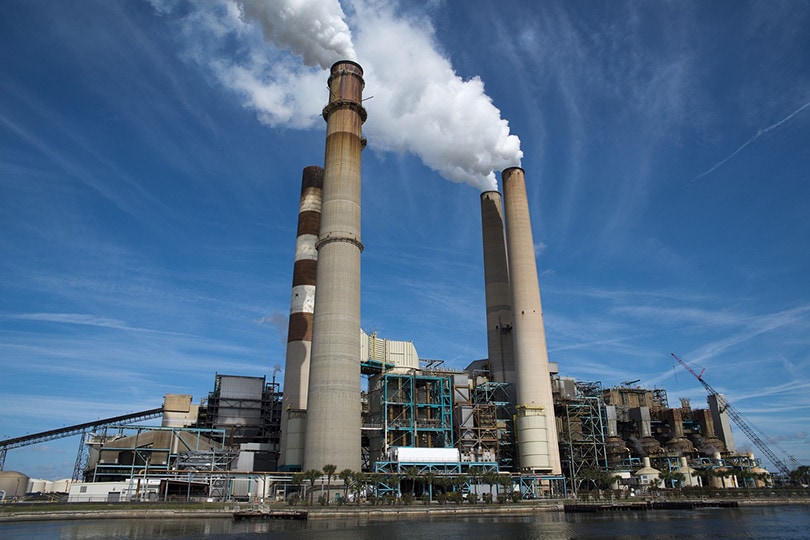
As the world’s population continues to grow, so does the amount of greenhouse gas (GHG) emissions that are produced. Greenhouse gases like carbon dioxide (CO2) are released into the atmosphere when we burn fossil fuels like natural gas, oil, and coal for energy.
These gases trap heat from the sun inside the Earth’s atmosphere, causing the Earth’s average temperature to rise.
Climate change is a result of this increased global temperature, and it is already having a significant impact on our planet. The effects of climate change are evident in extreme weather events, melting glaciers, and rising sea levels. Climate change also threatens human health, as it can lead to an increase in respiratory illnesses and vector-borne diseases.
In order to combat climate change, it is important to reduce the amount of greenhouse gases that are emitted into the atmosphere. One way to do this is by using clean energy sources that produce little or no GHG emissions.
Another way to reduce GHG emissions is through Carbon Capture and Storage (CCS) technologies, which capture carbon dioxide from industrial processes and store it in a safe location.
Canada is one of the world’s largest emitters of greenhouse gases, and the majority of these emissions come from the burning of fossil fuels for energy. In fact, the energy sector is responsible for around 80% of Canada’s total GHG emissions. However, there are some steps that the Canadian government is taking to reduce GHG emissions.
Click below to jump ahead:

The 17 CO2 & Greenhouse Gas Emissions Statistics in Canada
- Canada’s average emissions per person were 17.7 tons CO2e in 2020.
- As of 2020, Canada’s GHG emissions totaled 672.4 megatons (MT) of carbon dioxide equivalent.
- In 2020, the oil and gas sector emitted a total of 179.8 MT CO2e.
- From 2005–2020, Canada’s GHG emissions from power generation significantly declined by 52%.
- In 2020, Canada’s electricity grid emitted 110 grams of CO2e per kilowatt-hour (g of CO2e/kWh).
- Canada’s share of global annual GHG emissions has stayed below 2.0% since 1990.
- Oil and gas production is the primary source of greenhouse gases in Canada, emitting 179.8 million tons of carbon dioxide equivalent in 2020.
- The Canadian provinces with the most greenhouse gas emissions from power generation are Alberta and Saskatchewan.
- In 2019, energy demand in Canada was 12,305 petajoules (PJ).
- RPPs were the largest fuel type consumed in Canada in 2019, making up 4 953 PJ, or 40% of total consumption.
- In 2020, Canada’s total crude oil exports were estimated to be 3.7 million barrels per day (Mb/d), 2% lower than in 2019.
- In 2020, the importation of crude oil declined by 20%, from 693 thousand barrels a day (Mb/d) to 555 Mb/d.
- In 2020, around 88% of crude oil exports will be carried by pipeline, with the remainder moving by rail, sea, and truck.
- Although there are over 30 crude oil rail loading facilities in Canada, most of them are situated in western Canada.
- Alberta and British Columbia produced almost 98% of the country’s natural gas in 2020.
- In 2020, Canada was the world’s sixth-largest natural gas producer, producing 15.5 billion cubic feet each day (Bcf/d).
- About 812 Mb/d of natural gas liquids (NGLs) were produced in 2020 in Canada.


Greenhouse Gas Emissions
1. Canada’s average emissions per person were 17.7 tons CO2e in 2020.
(Canada Energy Regulator)
The Canadian government has set a target to reduce this number to 11.4 tons CO2e by 2030. It will take a combination of the effort of citizens and businesses to work to reduce the amount of CO2e released in the air.
2. As of 2020, Canada’s GHG emissions totaled 672.4 megatons (MT) of carbon dioxide equivalent.
(Canada Energy Regulator)
Although this is an increase from 1990 by 13.1%, it still marks a 9.3% decline since 2005.
3. In 2020, the oil and gas sector emitted a total of 179.8 MT CO2e.
(Canada Energy Regulator)
160.4 MT of the CO2e came from production, processing, and transmission and 18.4 MT came from petroleum refining and natural gas distribution.
4. From 2005-2020, Canada’s GHG emissions from power generation significantly declined by 52%.
(Canada Energy Regulator)
The majority of this slippage occurred from Ontario terminating its use of coal for power. Between those years referenced, Ontario went from generating 33.9 MT CO2e to a much lower 3.2 MT.
5. In 2020, Canada’s electricity grid emitted 110 grams of CO2e per kilowatt-hour (g of CO2e/kWh).
(Canada Energy Regulator)
That’s 110 g as opposed to the 2005 level of 220 g of CO2e/kWh. Moreover, this is a 50% reduction in emissions. The EU-27 electricity grid averaged 231 grams of CO2e/kWh while the U.S.’ intensity was 386 grams of CO2 2 / kWh.
Total Output
(Canada Energy Regulator)
Although Canada’s share of global annual GHG emissions has stayed below 2.0% since 1990, it still ranks high for GHG emissions per capita compared to other developed nations, such as the United States, Australia, and Luxembourg.
7. Oil and gas production is the primary source of greenhouse gases in Canada, emitting 179.8 million tons of carbon dioxide equivalent in 2020.
(Canada Energy Regulator)
Transportation was the second greatest emitter with 159.2 million tons of carbon dioxide equivalent, followed by industries and manufacturing at 94.4 million tons and buildings at 87.8 million tons.
Industrial and Fuel
8. The Canadian provinces with the most greenhouse gas emissions from power generation are Alberta and Saskatchewan.
(Canada Energy Regulator)
In 2020, GHG emissions from power generation in Alberta made up 52% of Canada’s total, while Saskatchewan was responsible for 22%.
9. In 2019, energy demand in Canada was 12 305 petajoules (PJ).
(Canada Energy Regulator)
The industrial sector accounted for 52% of overall demand, followed by 23% for transportation, 13% for residential, and 12% for business.
10. RPPs were the largest fuel type consumed in Canada in 2019, making up 4 953 PJ, or 40% of total consumption.
(Canada Energy Regulator)
Natural gas and electricity came second and third, respectively, accounting for 36% (4 416 PJ) and 16% (2 025 PJ) of fuel consumption.
11. In 2020, Canada’s total crude oil exports were estimated to be 3.7 million barrels per day (Mb/d), 2% lower than in 2019.
(Canada Energy Regulator)
In 2020, the aggregate value of Canada’s crude oil exports was approximately $60 billion. Despite year-over-year export volume stagnation in 2020, the average price paid for exported Canadian crude rose 32%.
12. In 2020, the importation of crude oil declined 20%, from 693 thousand barrels a day (Mb/d) to 555 Mb/d.
(Canada Energy Regulator)
These imports are normally light crude oil (which includes condensate) and mostly come into refineries located in central and eastern Canada.

13. In 2020, around 88% of crude oil exports will be carried by pipeline, with the remainder moving by rail, sea, and truck.
(Canada Energy Regulator)
Rail transport will account for 5% of overall export volumes in 2020.
14. Although there are over 30 crude oil rail loading facilities in Canada, most of them are situated in western Canada.
(Government of Canada)
In 2020, the average volume of crude oil exported by rail was 170 Mb/d. Although this is a decrease from 2019’s 280 Mb/d due to lower production caused by the pandemic, it is still significant nonetheless.
15. Alberta and British Columbia produced almost 98% of the country’s natural gas in 2020.
(Canada Energy Regulator)
Since Alberta and British Columbia are two of Canada’s largest provinces, this impacts the rest of the country in terms of natural gas production. Saskatchewan, New Brunswick, Ontario, and the Northwest Territories (NWT) all have minor amounts of natural gas.
16. In 2020, Canada was the world’s sixth-largest natural gas producer, producing 15.5 billion cubic feet each day (Bcf/d).
(Government of Canada)
From 2019, this is a 1.6% decrease. While there was a decrease in the past years, it is positive that Canada is in the top ten producers of natural gas.

17. About 812 Mb/d of natural gas liquids (NGLs) were produced in 2020 in Canada.
(Canada Energy Regulator)
This doesn’t include condensate and pentanes plus. Alberta contributed to half of this total production.
Frequently Asked Questions
How much carbon dioxide (CO2) enters the atmosphere each year?
Every year, approximately 740 million tonnes (MT) of carbon dioxide (CO2) enter the atmosphere from human activity in Canada. This is equivalent to about 20 tonnes for every person in Canada.
How have Canada’s total annual emissions of greenhouse gases changed over time?
Between 1990 and 2020, Canada’s total annual emissions of greenhouse gases increased by about 74%. This rise is largely due to increased emissions from the energy sector, including the transportation, industrial, and buildings sectors.
Which sources of emissions contribute the most to Canada’s total annual emissions?
The transportation sector is the largest source of emissions in Canada, accounting for about 27% of the total in 2013. This is followed by the industrial sector (23%), the buildings sector (11%), and the oil and gas sector (9%).
How do Canadian emissions compare to other countries’ emissions?
In 2012, Canada was ranked 10th among 42 countries in terms of total annual greenhouse gas emissions. On a per capita basis, however, Canada’s emissions were higher than most other countries, ranking 8th out of 37 countries.
What are some of the policies and programs in place to help reduce emissions?
A number of policies and programs are in place to help reduce emissions in Canada, including:
- The Canadian Environmental Protection Act and its regulations
- The Clean Air Act and its regulations
- The National Pollutant Release Inventory
- The Climate Change Plan for the Pan-Canadian Partnership on Clean Growth and Climate Change
- The Greenhouse Gas Pollution Pricing Act
Conclusion
As greenhouse gas emissions continue to increase, it is evident that something needs to be done in order to mitigate their effects. Despite this, it is encouraging to see that Canada has made great strides in reducing its emissions levels over the past few years.
Hopefully, with continued effort, Canada will be able to further reduce its emissions and help slow down climate change.
Featured Image Credit: Jonathan Borba, Unsplash
Contents
