Note: This article’s statistics come from third-party sources and do not represent the opinions of this website.
CO2, or carbon dioxide, is a type of greenhouse gas that is emitted as a result of human actions, although it is only one of several such gases. Our CO2 production is causing the atmosphere to heat up and having a devastating effect on the climate. Targets have been set to reduce these levels to zero within the next 25 years or so, but the figures show that more needs to be done if these targets are to be hit.
Although the global Covid pandemic was devastating, it did see a reduction in CO2 and general greenhouse gas emissions, although levels look set to return to pre-pandemic levels now that lockdowns and other restrictions have been lifted.
Below are 13 statistics related to CO2 and greenhouse gas emissions in the UK using recent figures.
Click below to jump ahead:

The 13 CO2 and Greenhouse Gas Emissions Statistics in the UK
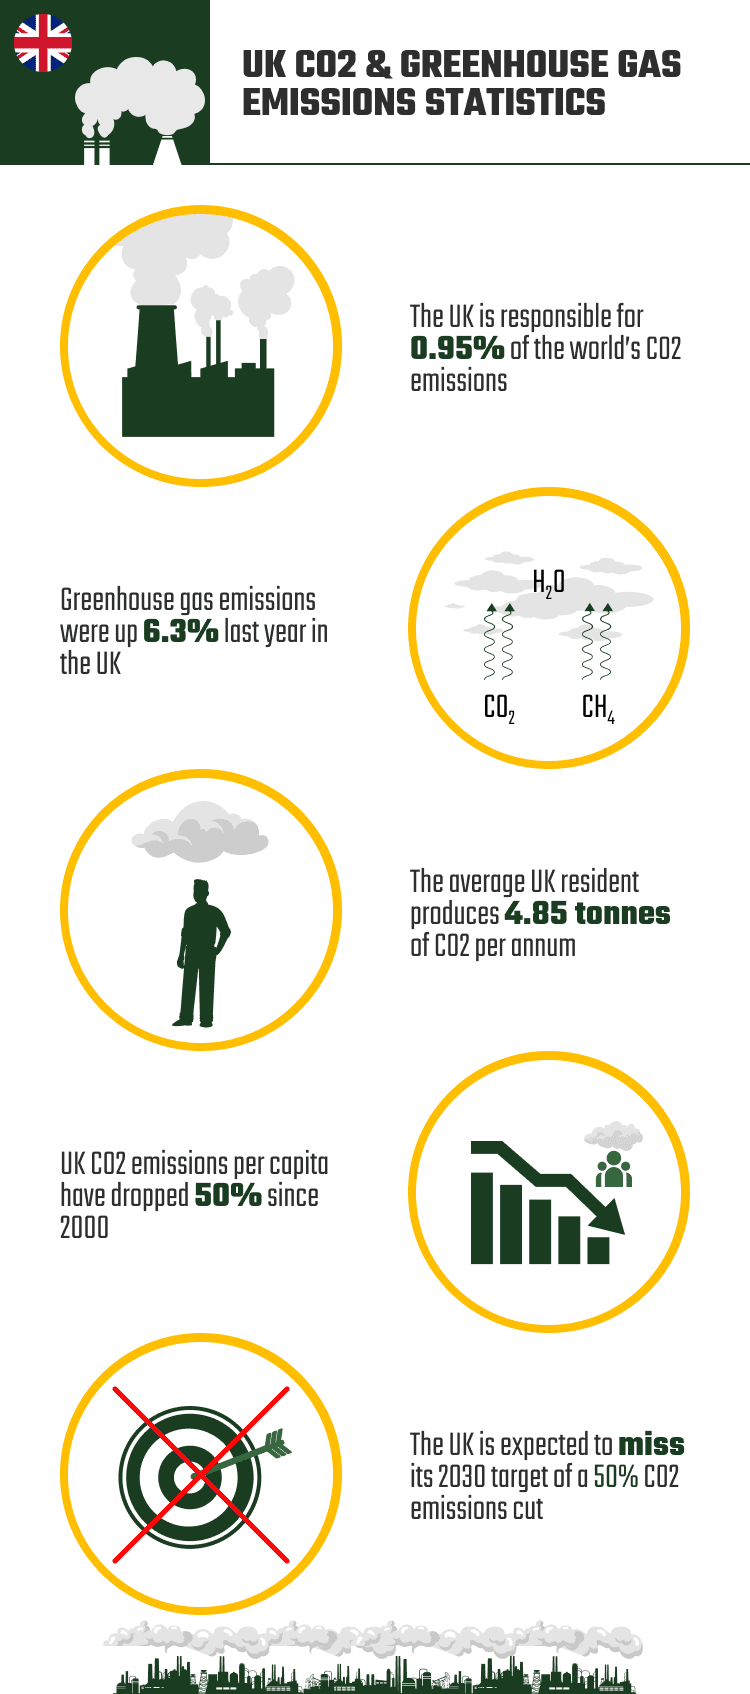
- The UK is responsible for 0.95% of the world’s CO2 emissions.
- 40% of all emissions come from households.
- Greenhouse gas emissions were up 6.3% in 2021 compared to 2020.
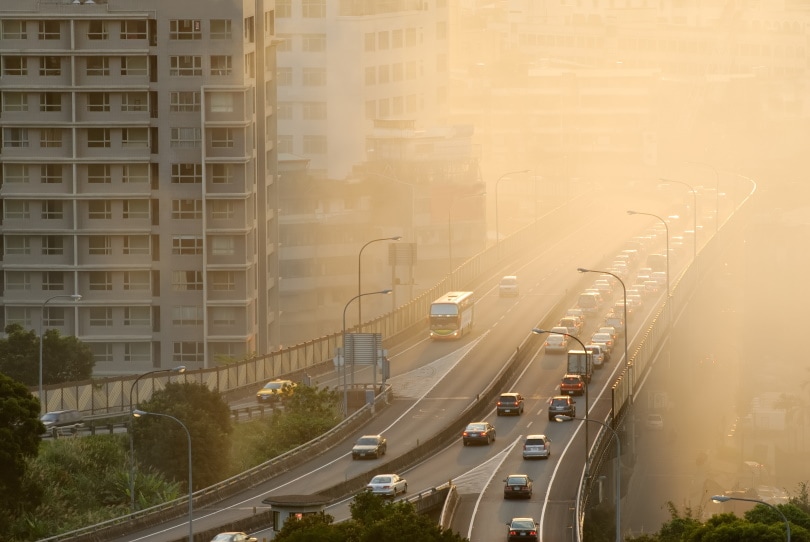
- 2021’s greenhouse gas emissions increase was led by a 10% increase in CO2 emissions from transportation.
- 2021 greenhouse gas emissions were 5% lower than in pre-Covid 2019.
- CO2 emissions fell 29% between 2009 and 2019.
- 2019 carbon emission levels were the lowest they have been since 1888.
- The UK is expected to miss its CO2 emissions 2030 target.
- The average UK resident produces 4.85 tonnes of CO2 per annum.
- CO2 emissions per capita have dropped 50% since 2000.
- 2020 saw a 9.5% decrease in greenhouse gases, as a result of the Covid pandemic.
- 2020 greenhouse gas emissions from transport were down 19.2%.
- Energy greenhouse gases fell 12.2% in 2020.
Total Emissions
1. The UK is responsible for 0.95% of the world’s CO2 emissions.
(Our World In Data)
When looking at the total amount of CO2 emissions around the world, the UK is responsible for 0.95% of all emissions. While that does not sound a lot, the UK’s population of just over 67 million is equivalent to just 0.87% of the global population, which means that the UK is arguably responsible for more than its share of emissions.

2. 40% of all emissions come from households.
(The CCC)
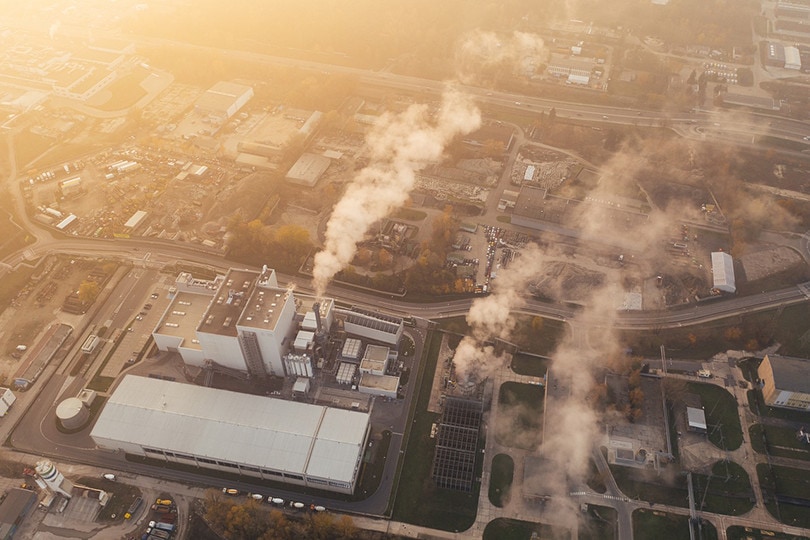
Several types of greenhouse gases are emitted. Carbon Dioxide, or CO2, makes up approximately 65% of all greenhouse gases, and the main source of CO2 emissions is fossil fuels. Energy, industry, agriculture, transport, and buildings are the biggest contributors to CO2, but it’s estimated that around 40% of all emissions are from households, which means that individuals can do their part to try and reduce CO2 emissions.
3. Greenhouse gas emissions were up 6.3% in 2021 compared to 2020.
(UK Gov 1)
Although 2021 did see some Covid lockdowns and partial lockdowns across the UK, they were not as significant as in 2020. As such, activity rose, and so too did emissions of CO2 and other greenhouse gases. In total, greenhouse gas emissions rose 6.3% in 2021 compared to 2020.
4. 2021’s greenhouse gas emissions increase was led by a 10% increase in CO2 emissions from transport.
(UK Gov 1)
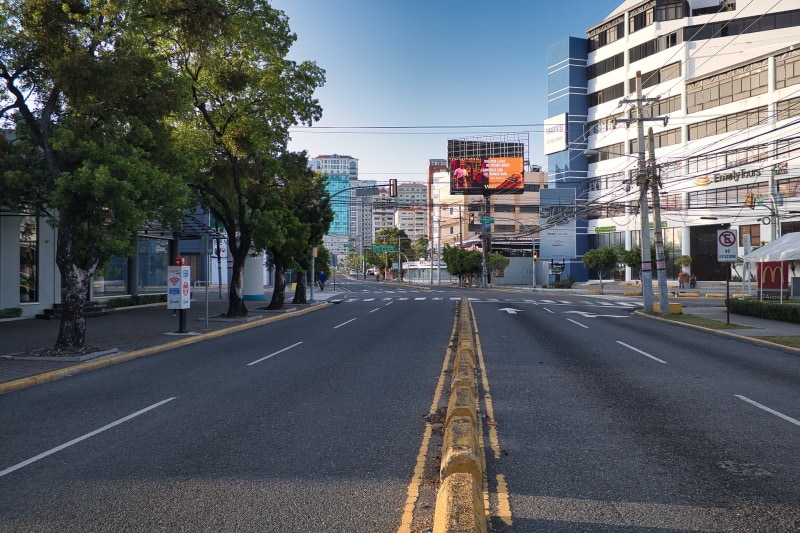
One of the most significant changes seen during 2020 was a drop in traffic levels. When the country was in lockdown, people could not drive unless necessary for travel. And, even when the country wasn’t in lockdown, people were encouraged to work from home. Fewer deliveries of goods and products were also made across the year. As the country opened up again in 2021, this saw more traffic back on the roads. As a result of this, CO2 emissions caused by traffic rose 10% in the year.
5. 2021 greenhouse gas emissions were 5% lower than in pre-Covid 2019.
(UK Gov 1)
Despite the 6.3% increase in greenhouse gas emissions compared to 2020, 2021’s emissions were still considerably lower than in 2019, which was the last full year before the Covid pandemic took hold. In fact, 2021’s figures were 5% lower than in 2019. 2022 has seen further openings and fewer restrictions, which means that the figures will likely record another increase in 2022.
6. CO2 emissions fell 29% between 2009 and 2019.
(Carbon Brief)
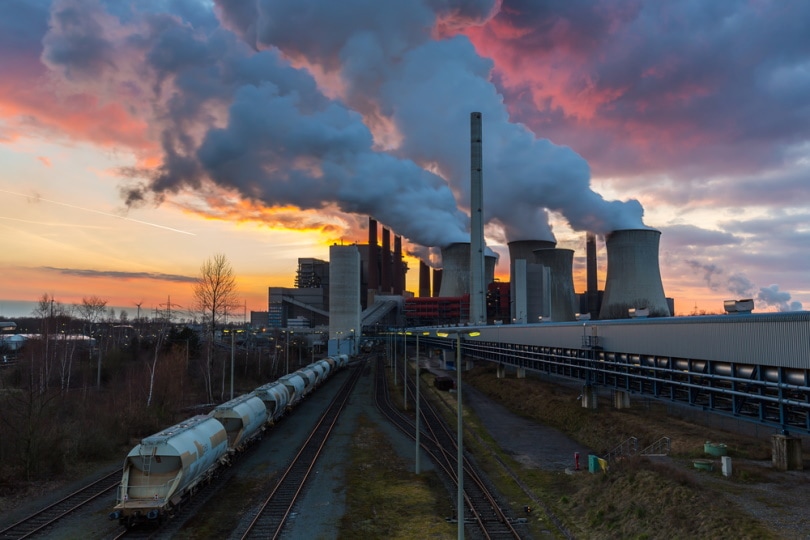
The years 2020 and 2021 were extraordinary years, and 2019 was the last meaningful year of CO2 emission data. Despite the economy growing by a fifth, CO2 emissions actually fell by 29% between 2009 and 2019. The 2019 year also represented the 7th consecutive year of CO2 decline. The total fall was led by an 80% reduction in coal emissions, a 20% reduction in gas emissions, and just a 6% reduction in oil emissions.
7. 2019 carbon emission levels were the lowest they have been since 1888.
(Carbon Brief)
The significant drop in emissions meant that emissions in 2019 were as low as they have been since 1888. Despite these drops, the country still has a long way to go to reduce emissions enough to make a significant difference.
8. The UK is expected to miss its CO2 emissions 2030 target.
(Carbon Brief)
Despite the fact that emissions dropped significantly for 10 years, experts suggest that the UK will miss its 2030 targets at the current rate. A further 31% fall would be required in the next 8 years to meet those targets, but we are only expected to see a decline of around 10% over that period. The country is also likely to fall short of its net-zero 2050 target unless further policy changes are made.
Per Capita Emissions
9. The average UK resident produces 4.85 tonnes of CO2 per annum.
(Our World In Data)
According to some sources, each UK citizen produces just under 5 tonnes of CO2 per annum. The government argues that individuals aren’t responsible for these emissions. When taking the country’s total emissions and dividing it by the population, every citizen produces 10 tonnes of CO2.

10. CO2 emissions per capita have dropped 50% since 2000.
(Statista)
Taking the 4.85 tonnes of emissions as being accurate and applying the same data shows that the CO2 per capita rate has dropped 50% since 2000. It has only dropped 60% in the past 50 years, which shows that significant improvements have been made in the past 20 years. But will it be enough?
The Effects of Covid
11. 2020 saw a 9.5% decrease in greenhouse gases, as a result of the Covid pandemic.
(UK Gov 2)
While2020 was an extraordinary year in many senses, the UK, like most countries around the world, saw full lockdowns implemented in a bid to curb the spread of the Covid pandemic. While there were very few positives to the pandemic, there was a massive reduction in greenhouse gas emissions and, in particular, CO2 emissions. Overall, there was a 9.5% decline in greenhouse gas emissions in 2020 compared to 2019.

12. 2020 greenhouse gas emissions from transport were down 19.2%.
(UK Gov 2)
The biggest drop in greenhouse gas emissions in 2020 came from transport. Not only were people working from home and therefore not driving to and from work, but many shops were shut down and industries closed. This meant that less produce and materials were shipped across the country. This reduction in traffic led to a 19.2% reduction in greenhouse gas emissions from transport.
13. Energy greenhouse gases fell 12.2% in 2020.
(UK Gov 2)
The country consumed less electricity during the pandemic, too. Large industries were shut down, shops and commercial buildings were closed, and manufacturing ground to a halt. As a result, less energy was consumed across the board and there was a 12.2% reduction in emissions from energy production during the year.

Frequently Asked Questions
Are greenhouse gas emissions and CO2 the same?
CO2 is one of a number of greenhouse gases and is the primary greenhouse gas that is emitted by humans and human activities. It accounts for nearly 80% of all greenhouse gas emissions. Other greenhouse gases include methane and nitrous oxide. (EPA)
What is the biggest contributor to CO2 emissions?
Fossil fuel is the single biggest contributor to CO2 emissions. This includes fossil fuels used to generate electricity but also to produce fuel for cars, and oil. The transport sector produces the most CO2 emissions. The recent increase in fuel prices, led by increases in oil prices, has led to more people buying electric cars, but this change needs to accelerate to further reduce the CO2 emissions that road, rail, water, and air freight produce.
What are the main sources of greenhouse gas emissions?
As well as transport, other major contributors to greenhouse gas emissions include electric power, industry, commercial and residential, and agriculture respectively.
What are ways we can reduce carbon dioxide emissions?
While there is little that we as individuals can do about the CO2 emissions produced by businesses, we can buy products and use services that have pledged to produce less CO2 themselves. We can also ensure that our homes are well insulated, upgrade our heating systems, and ensure that we properly use heating controls so that we aren’t needlessly using too much power especially when we don’t need it. Lower carbon travel also helps this. You can cycle rather than drive or walk rather than take the bus whenever possible.
Conclusion
Most governments around the world have set carbon zero or carbon neutral targets. The UK government has said they aim to ensure that the country is carbon neutral by the year 2050. At the current rate, it is unlikely that we will hit that target, despite some reduction in CO2 and greenhouse gas emission levels as shown in the statistics above. There are steps that individuals can also take to help reduce greenhouse gas emissions, especially CO2 emissions. While buying an electric car isn’t an option for all of us, we can reduce our use of fossil fuels with some simple steps.
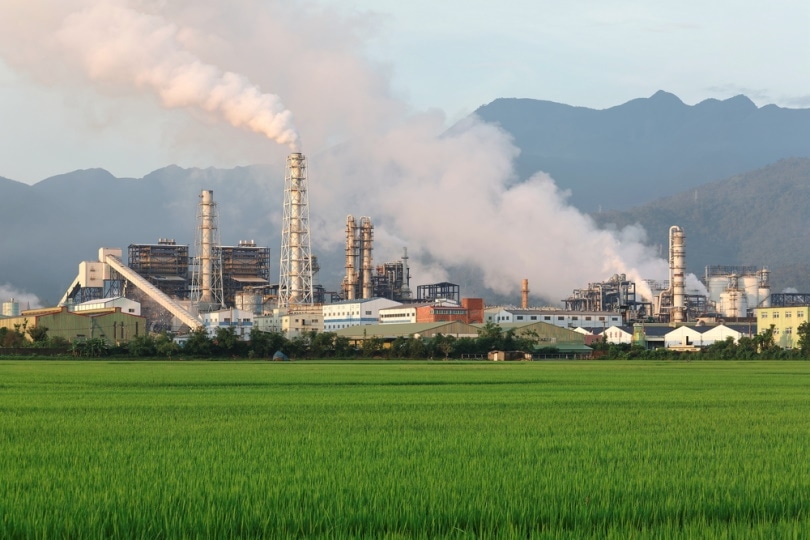
Featured Image Credit: CHEN MIN CHUN, Shutterstock
Contents