25 Safest Cities in Canada (with Pictures)
-
Shea Cummings
- Last updated:

Note: This article’s statistics come from third-party sources and do not represent the opinions of this website.
Canada is a massive country with incredible cultural diversity. And it also has a diverse range of climates to match. While both things play into a person’s decision on where they want to live and raise families. Perhaps, more decisive factors are how high the general crime rate is and how safe your belongings are.
Below, we will see how 25 cities in Canada stack up to national averages when comparing a few metrics. The Crime Severity Index (CSI), property crime, and controlled drug offenses will play a part in a city’s inclusion on the list. National averages for these three stats are 75.01, 431.24, and 31.58, respectively.
The 25 Safest Cities in Canada: A Quick Look
1. LaSalle, ON
| Population: | 32,899 |
| CSI: | 15 |
| Property Crime: | 100.34 |
| Controlled Drug Trafficking/Production (per 100k): | 9.12 |
According to the most recent statistics gathered by Maclean’s, LaSalle comes in as the safest city in Canada. There was almost zero violent crime, and property crime was not even a quarter of the national average. Two things to note were a slight increase in controlled drug crimes, and fraud was up.
2. Hamilton Township, ON
| Population: | 11,262 |
| CSI: | 22 |
| Property Crime: | 230.86 |
| Controlled Drug Trafficking/Production (per 100k): | 8.88 |
Compared to its size, Hamilton had a fair amount of property crimes. However, it is worth noting that property crime was down and almost less than half of the national average. Another point is that all crime in Hamilton is far below average—even though some of those stats did show a slight increase.
3. Oak Bay, BC
| Population: | 18,702 |
| CSI: | 27 |
| Property Crime: | 160.41 |
| Controlled Drug Trafficking/Production (per 100k): | 0 |
All crime is trending downward with the latest stats on Oak Bay, except for assault and sexual assault, which are both up. Even with assaults up a bit, the CSI is less than half the national average. In addition, the Violent Crime Severity Index is only 12 compared to the national average of 87.03 (Statistics Canada).
4. Halton Region, ON
| Population: | 580,014 |
| CSI: | 27 |
| Property Crime: | 171.5 |
| Controlled Drug Trafficking/Production (per 100k): | 5 |
For its large size, Halton has an impressively low crime rate. Even though most of the stats are showing an increase with the latest statistics and both CSI and VCSI have gone up, all the offenses are still way below the national average. Furthermore, the five-year average only showed an increase of 1.9 in CSI, which is respectable in a town of over half a million.
5. Lakeshore, ON
| Population: | 39,599 |
| CSI: | 28 |
| Property Crime: | 166.84 |
| Controlled Drug Trafficking/Production (per 100k): | 0 |
Over the last five years, Lakeshore has seen a slight increase of 6 in its CSI. Even with this increase, offenses across the board are still well under the country’s averages. One area that the city seems to be struggling a little is with fraud and youth-related offenses. But neither of these has a huge impact on the overall danger of the city.
6. North Saanich, BC
| Population: | 11,731 |
| CSI: | 28 |
| Property Crime: | 136.39 |
| Controlled Drug Trafficking/Production (per 100k): | 0 |
Another community from Vancouver Island makes it onto the list of the safest cities, securing the idea that island life is a good life. Even though it has a great CSI on paper, it’s not to say there was zero crime that took place. North Saanich had some assaults and break and enters, but not enough to drive up their CSI significantly.
7. Warman, SASK
| Population: | 14,158 |
| CSI: | 28 |
| Property Crime: | 134.2 |
| Controlled Drug Trafficking/Production (per 100k): | 14.13 |
Warman is the first city on this list from Saskatchewan, and it deserves its spot. The average CSI has dropped 4.92 over the last five years. Considering its population, there are some issues with assault and sexual assault. Both stats went up in the latest report. Fortunately, both remain well under the national average.
8. Levis, QC

| Population: | 146,080 |
| CSI: | 30 |
| Property Crime: | 115.69 |
| Controlled Drug Trafficking/Production (per 100k): | 16.43 |
Over the last five years, the average CSI has dropped by 4.91, which is excellent even though it wasn’t high to begin with. One negative is that the VCSI has increased slightly to 35. Still, it remains less than half of the national average even with the increase. The main contributing factor to this upwards movement was a slight increase in assaults. But Levis remains a safe place to live in and visit.
9. Elgin County, ON
| Population: | 44,838 |
| CSI: | 31 |
| Property Crime: | 218.56 |
| Controlled Drug Trafficking/Production (per 100k): | 13.38 |
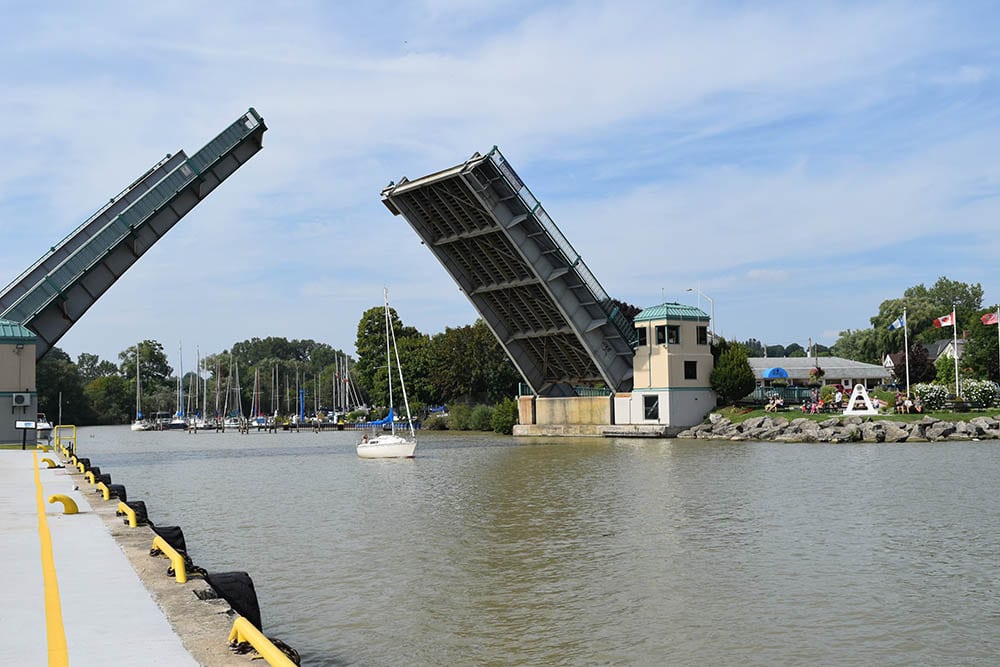
Multiple types of drug offenses were up in Elgin Country in the latest report, and this appeared to lead to an increase in assault and sexual assault, which were both up. But even with this increase, the overall average over five years still showed a decrease in the CSI of 0.05. Also, property crime has dropped below half of the national average.
10. Caledon, ON

| Population: | 72,568 |
| CSI: | 32 |
| Property Crime: | 209.46 |
| Controlled Drug Trafficking/Production (per 100k): | 8.27 |
While Caledon ranks reasonably high on this list, some troubling facts are coming through on the latest report from Maclean’s. This year, while many of the crime stats have gone down, homicides and sexual assault were both up. The most troubling thing is an overall average increase of 7.49 in its CSI over five years. However, even with these increases, Caledon is still proving to be a safe city overall.
11. Blainville, QC
| Population: | 59,756 |
| CSI: | 32 |
| Property Crime: | 184.08 |
| Controlled Drug Trafficking/Production (per 100k): | 20.08 |
If there were an award for “most improved CSI”, then Blainville would be on a shortlist to get it. They saw a whopping improvement of -11.9 over five years. This was a much-needed change for the city as many of its stats were approaching the country’s average. Being on par with averages is not a bad thing. But when many cities are well below, it says something about the safety factor of a city that can only manage an average CSI.
12. Wellington County, ON
| Population: | 96,345 |
| CSI: | 32 |
| Property Crime: | 201.36 |
| Controlled Drug Trafficking/Production (per 100k): | 13.49 |
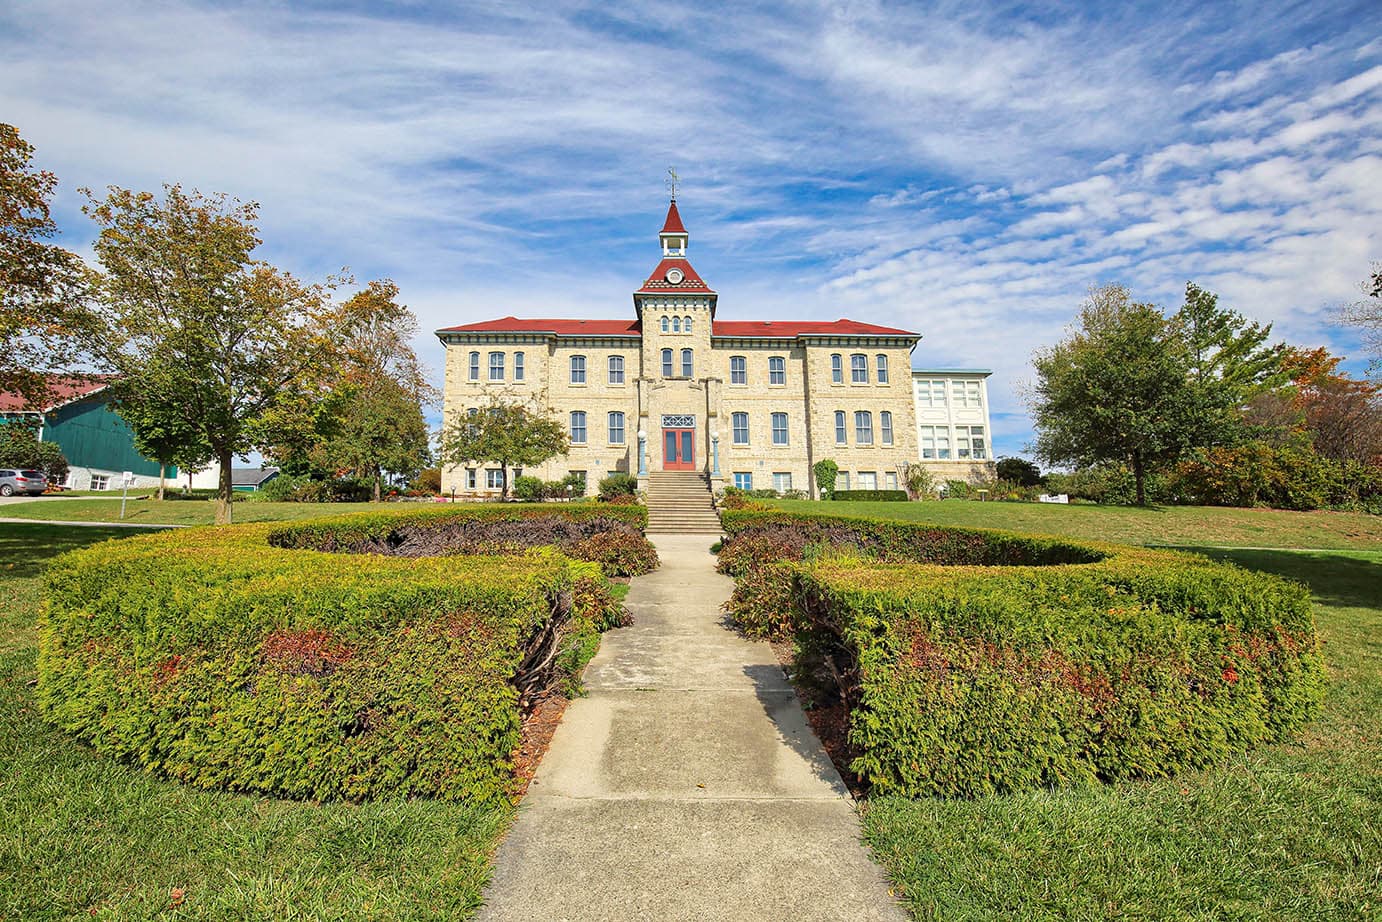
Wellington County is on this list for now, but if the upward trend they are in now continues, they will slide lower in the list every year. So far, they are tracking an increase of 2.94 overall in their CSI score over five years, and in the latest report, all crime stats are showing an increase. Statistics constantly fluctuate year-to-year, but it gets concerning when the trend stays upward.
13. Central Saanich, BC
| Population: | 17,951 |
| CSI: | 33 |
| Property Crime: | 122.56 |
| Controlled Drug Trafficking/Production (per 100k): | 11.14 |
Compared to its northern neighbor of the same name, Central Saanich is not doing quite as well with its crime. While it still has an incredible CSI compared to the national average, they are having problems with a rise in controlled drug offenses and impaired driving charges. Both things certainly play into a community’s safety.
14. Port Moody, BC
| Population: | 35,138 |
| CSI: | 36 |
| Property Crime: | 199.21 |
| Controlled Drug Trafficking/Production (per 100k): | 5.69 |
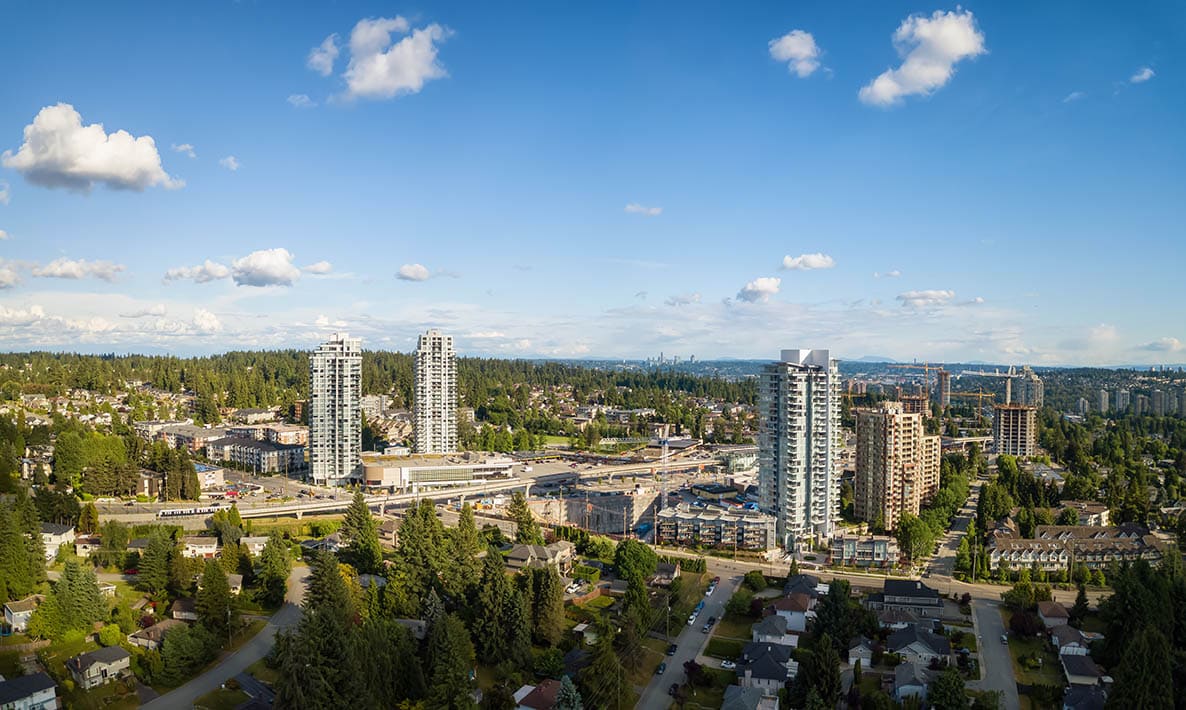
With a five-year change of -1.9 in their CSI, Port Moody is on the right track. With an already relatively low crime rate, they saw a decrease in all categories again in the latest report. One area that seems to be a massive hurdle to overcome is the impaired driving charges. They are sitting at nearly double the national average, but this alone is not a reason to take them off this list.
15. Terrebonne, QC
| Population: | 140,301 |
| CSI: | 37 |
| Property Crime: | 165.36 |
| Controlled Drug Trafficking/Production (per 100k): | 16.39 |
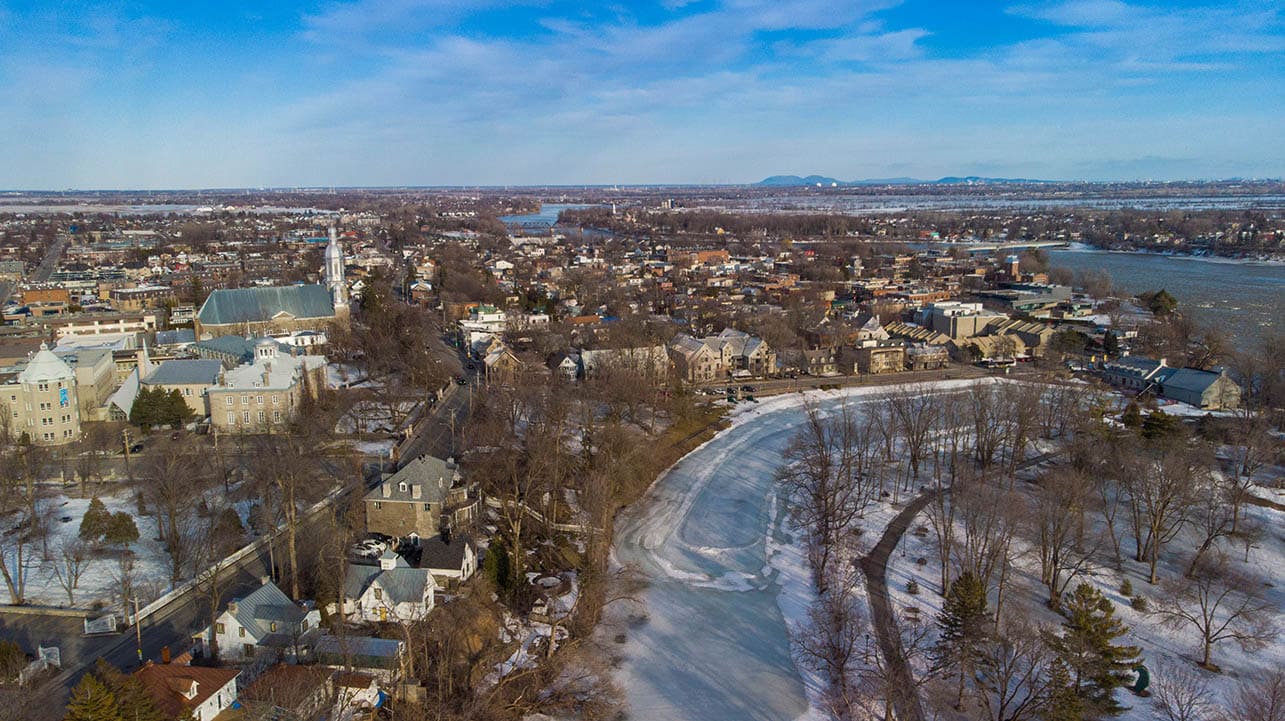
Another city that should make it to a list of “most-improved” is Terrebonne. It saw a massive -19.5 change in its CSI over five years. This was a necessary improvement as the city approached the national average mark for many crimes. It is important to note that even an average CSI is not terrible when considering a city of 140,000 people.
16. Colwood, BC

| Population: | 18,276 |
| CSI: | 37 |
| Property Crime: | 153.21 |
| Controlled Drug Trafficking/Production (per 100k): | 5.47 |
A common theme we see in this list is the safety on Vancouver Island. Colwood is the fourth island community included. It’s no wonder that CTV news named seven different cities on Vancouver Island as the best places to live in Canada (CTV). Even with an increase of 2.94 in its CSI over five years, Colwood still deserves its spot on this list, with crime scores well below the country’s average.
17. Richelieu-Saint-Laurent region, QC
| Population: | 209,246 |
| CSI: | 37 |
| Property Crime: | 252.81 |
| Controlled Drug Trafficking/Production (per 100k): | 3.82 |
Violent crime is up in this eastern city, but overall, the CSI has dropped 5.47 over five years. So, even with many statistics increasing on the latest report, the trend is still downward. One thing worth mentioning is even with violent crime going up, the number of homicides dropped, which is great in a city with over 200,000 people.
18. Port Hope, ON
| Population: | 13,860 |
| CSI: | 38 |
| Property Crime: | 173.16 |
| Controlled Drug Trafficking/Production (per 100k): | 14.43 |
Port Hope has had its problems with crime across the board for such a small town—from assault to property crime to drugs. These stats continue to hover at rates higher than other Ontario cities on this list. According to the latest report, a significant positive is that both violent crime and property crime have decreased. Drug crimes have gone up but remain well below the national average.
19. Brighton, ON
| Population: | 12,691 |
| CSI: | 38 |
| Property Crime: | 157.59 |
| Controlled Drug Trafficking/Production (per 100k): | 23.64 |
While the CSI and VCSI both sit well below average in Brighton, there is a much higher rate of sexual assaults here than anywhere else on this list—and those assaults are well above the national average at 102.43 per capita. However, even with sexual assault being so prevalent, Brighton remains a safe city otherwise.
20. Comox, BC

| Population: | 14,898 |
| CSI: | 39 |
| Property Crime: | 214.79 |
| Controlled Drug Trafficking/Production (per 100k): | 0 |
It’s hard to say what’s been happening in Comox, but over five years, they saw a jump of 6.05 in their CSI, and again in the latest report, everything was still going up. However, it must be noted that even with this upward trend, Comox still sits under the national average crime rate and thus remains a safe city to live in or travel to.
21. Beaumont, AB
| Population: | 19,791 |
| CSI: | 40 |
| Property Crime: | 146.53 |
| Controlled Drug Trafficking/Production (per 100k): | 5.05 |
Overall, Beaumont proves to be a safe city. However, it’s worth noting that assault and fraud are quite high. The rest of the city’s crime is far enough below the national average to keep the CSI from climbing too high. However, the CSI has increased by 4.45 overall over the last five years.
22. Sidney, BC
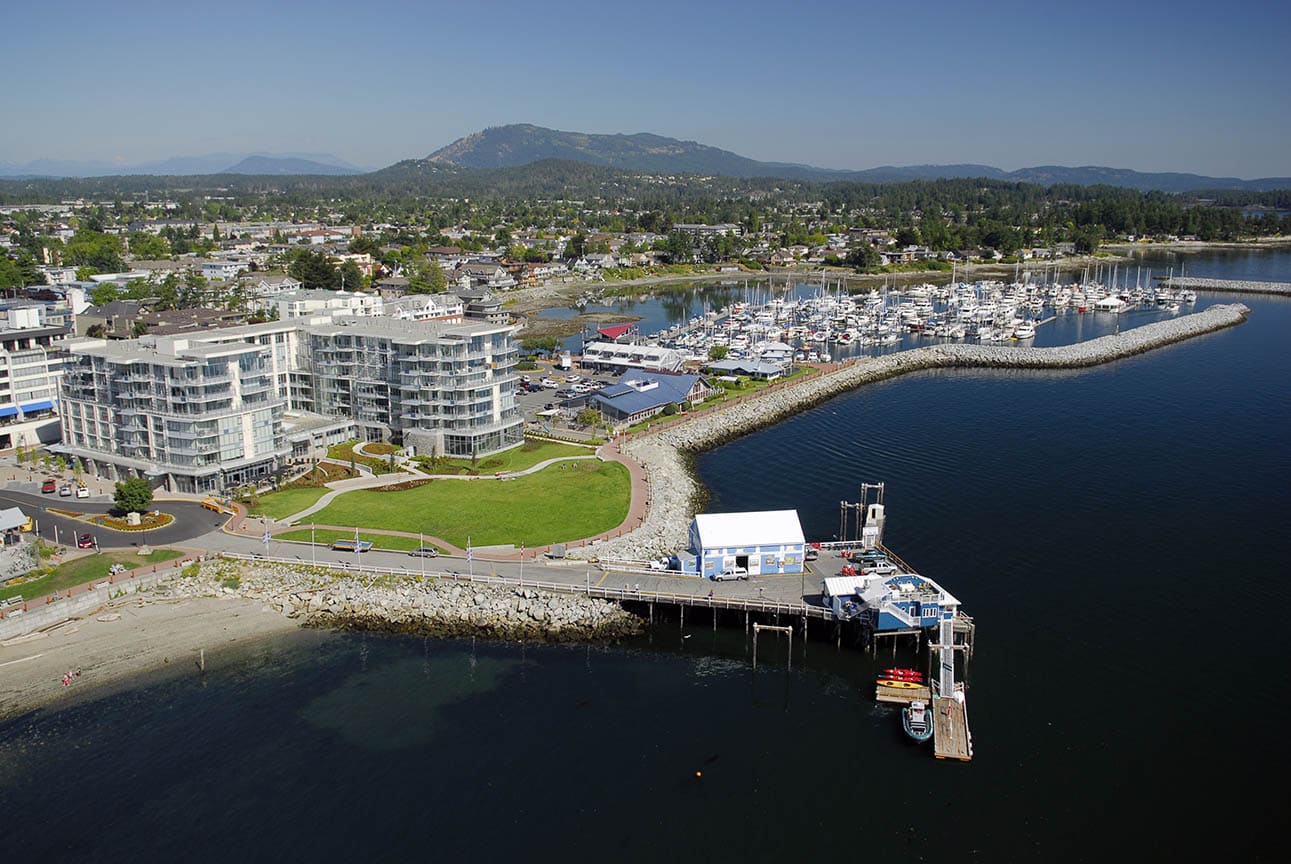
| Population: | 12,179 |
| CSI: | 41 |
| Property Crime: | 123.16 |
| Controlled Drug Trafficking/Production (per 100k): | 0 |
In Sidney, the worst thing that will probably happen is becoming a fraud victim. Drug crime is almost non-existent except for cocaine-related offenses. Property crime is low and going down, and both types of assault are well below the national average and falling.
23. Collingwood, ON
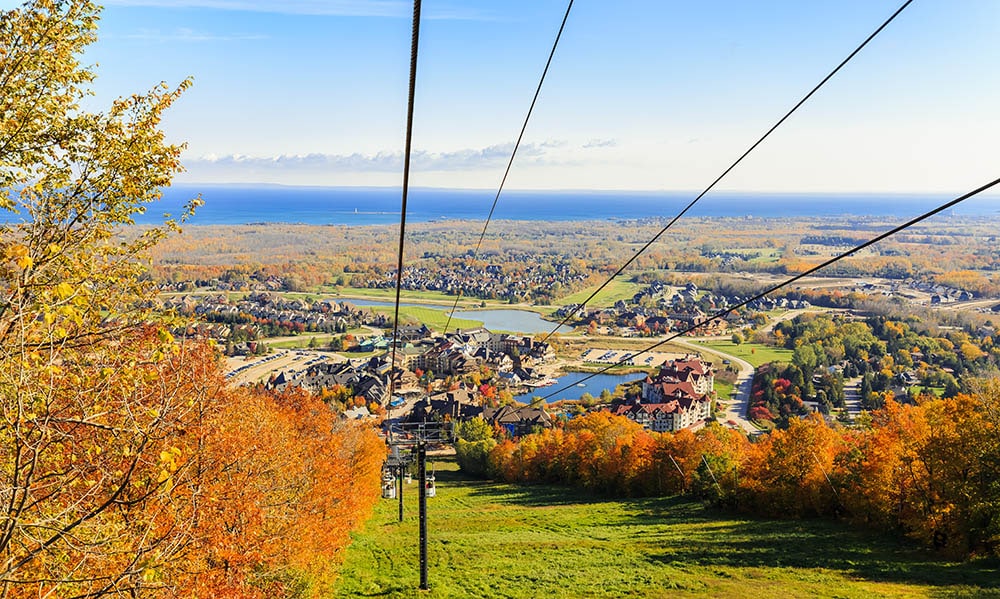
| Population: | 23,472 |
| CSI: | 43 |
| Property Crime: | 166.16 |
| Controlled Drug Trafficking/Production (per 100k): | 38.34 |
Even with a decrease of 11.24 in its CSI over five years, Collingwood still has some hurdles to overcome. Its controlled drug crimes, fraud, and both types of assault are all either higher than the national average or close to it. With that being said, Collingwood still ranks as a safe city with a CSI and VCSI, both almost half that as the rest of the country.
24. North Vancouver District Municipality, BC
| Population: | 89,435 |
| CSI: | 44 |
| Property Crime: | 333.2 |
| Controlled Drug Trafficking/Production (per 100k): | 1.12 |
One might be surprised to find a major city like Vancouver on a list of safe cities with major centers usually having higher crime rates (Chicago University). Keep in mind; this is a smaller community within Vancouver. Still, it is impressive how local police can keep up on the crime. Perhaps, the most shocking statistic is the almost zero drug activity, plus violent and property crimes are well below national averages.
25. Cochrane, AB

| Population: | 30,082 |
| CSI: | 50 |
| Property Crime: | 186.16 |
| Controlled Drug Trafficking/Production (per 100k): | 16.62 |
In Maclean’s latest report, Cochrane has a downward trend on all violent crime and property crime. However, drug offenses are up, and impaired driving charges are through the roof. Overall, this city is still rated as a safe city, especially if the main worry is being a victim of violent crime.
- Related Read: 12 Hottest Cities in Canada
How to Stay Safe in Canada
Compared to many other countries in the world, Canada consistently rates in the top ten for the safest cities in the world (Vision of Humanity). This doesn’t mean that care does not need to be taken when traveling or moving to a new area. It is still a best practice to familiarize yourself with an unfamiliar place to know if there are certain areas to be more careful in or avoid altogether.
The fact that two out of five Canadians reside in Ontario (Provincial Website), and a large majority of the safest cities and towns in the country are in that province is a huge testament to the relative safety of this beautiful country.
Conclusion
It’s easy to read “most dangerous city” lists and get anxious even thinking about new places to see and explore. So, it’s a breath of fresh air to know that we can enjoy Canada without a lot of thought needed to stay safe—especially if we are going to be enjoying eastern Canada.
- Macleans (all city data, unless otherwise noted)
- Statistics Canada
- CTV
- Chicago University
- Provincial Website
- Vision of Humanity
Featured Image Credit: geraldfriedrich2, Pixabay
Contents
