

The world has a long way to go in scaling back CO2 emissions and a short time to do it. Energy-related emissions saw a record increase in 2021, reaching over 36 billion metric tons, nearly two times the level we need to achieve by 2030 to limit warming to 2.7 degrees by the end of the century. At only 3%, the current end-of-decade global emissions reduction goals are far from the 45% drop we need to stay on pace.
Cutting back emissions is now only one side of the fight against global warming. As renewable energy projects take off to replace gas and coal, other initiatives are focusing on carbon negativity and the role of carbon capture.
Carbon capture and storage (CCS) facilities redirect CO2 emissions before they reach the atmosphere, trapping them deep in underground reservoirs. It’s a critical solution to a worsening problem and one that may shape consumer markets as technology evolves. Let’s break down some basic carbon capture statistics to see where it fits in the fight against global warming.

The 9 Carbon Capture Statistics
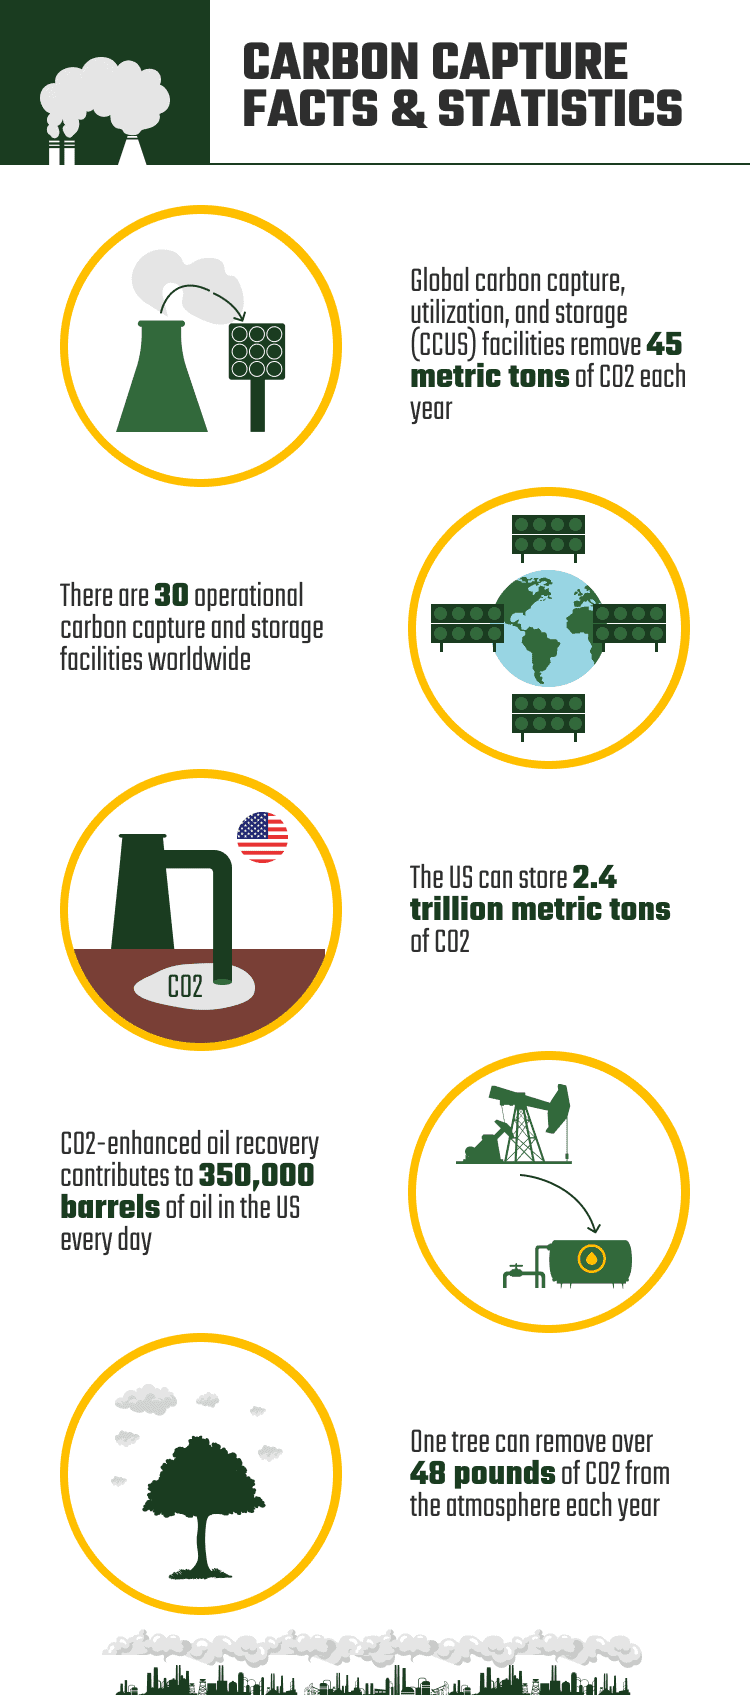
- Global carbon capture, utilization, and storage (CCUS) facilities remove 45 mt of CO2 each year.
- There are 30 operational carbon capture and storage facilities worldwide.
- Shute Creek Gas Processing Plant captures the most CO2 of any CCS facility at 7 million metric tons (7 mt) per year.
- Wyoming’s Project Bison could remove up to 5 million tons of CO2 from the air each year by 2030.
- The U.S. can store 2.4 trillion metric tons of CO2.
- CO2-enhanced oil recovery contributes to 350,000 barrels of oil in the U.S. every day.
- The Earth naturally cycles 100 billion tons of CO2 every year.
- One tree can remove over 48 pounds of CO2 from the atmosphere each year.
- A single whale can sequester 33 tons of CO2 in their lifetime.
 Carbon Capture Around the Globe
 Carbon Capture Around the Globe
1. Global carbon capture, utilization, and storage (CCUS) facilities remove 45 mt of CO2 each year.
(IEA)
The world currently captures nearly 45 million metric tons (mt) of carbon. Capture statistics have tripled since 2010, when operational facilities only pulled in roughly 13 mt of CO2. And the projected development numbers show even more impressive growth.
Investment stalled midway through the 2010s, with early development and advanced development projects accounting for only 21 mt in carbon capture in 2017. Advanced development projects have a high chance of construction due to substantial funding.
Fast-forward 5 years and the outlook has changed considerably. The combined in-development projects can now manage nearly 190 mt. From only one year prior, advanced development capacity jumped from 49.41 mt to 97.6 mt in 2022, indicating a significant push from government and industry leaders to propel growth.
The plans are a vast improvement over the current state of carbon capture but still far from adequate. Even with an additional 113 mt capacity from anticipated advanced development-stage facilities and 99 mt from concept-stage projects, the world would still fall more than 1,000 mt short of a 2030 Net Zero scenario.
2. There are 30 operational carbon capture and storage facilities in the world.
(Global CCS Institute)
Currently, 30 CCS facilities are operating globally, a minor fraction of the in-development projects that have surged forward in the past year. The CCS pipeline now contains 196 projects, reflecting a 44% increase from 2021. The 166 unrealized projects include the following:
- 11 facilities under construction
- 78 facilities in advanced development
- 75 facilities in early development
- 2 suspended operations
If all these projects came to fruition, they would capture more than 200 mt of carbon dioxide on top of the current operating capacity. With 34 new projects, the U.S. is leading the carbon capture trend, followed by Canada (19 new projects) and the U.K. (13).
Carbon Capture in America
3. Shute Creek Gas Processing Plant captures the most CO2 of any CCS facility at 7 million metric tons annually.
(Statista)
The world’s 30 plants don’t divide the 45 mt of carbon capture equally. U.S. sites do much of the heavy lifting, and Wyoming’s Shute Creek Gas Processing Plant, an ExxonMobil facility, leads the way with a 7-mt per annum (mtpa) capacity. The Century Plant in Texas has the second-highest usage of 5 mtpa, though its capacity is higher than that of the Shute Creek Facility.
The remaining facilities capture roughly 4 mt of CO2 or fewer each year. New projects hope to change that, particularly those in early development in the U.S. and U.K.
The Illinois Clean Fuel project, a synthetic fuel production facility, will turn solid waste into sustainable aviation fuel while sequestering over 8 mtpa of CO2. Meanwhile, the Drax project in the U.K. will capture another 8 mt in the world’s largest bioenergy with CCS (BECCS) facility.
4. Wyoming’s Project Bison could remove up to 5 million tons of CO2 from the air each year by 2030.
(Business Wire)
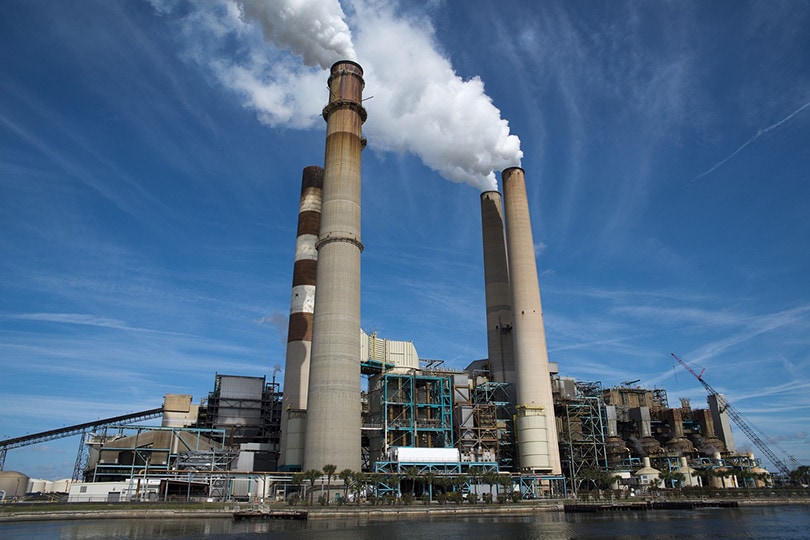
Most of the 30 global CCS facilities work to offset the effects of their attached carbon emitters. Gas and coal energy facilities, cement manufacturers, and other polluters release GHG, and the CCS facility immediately removes over 90% of it for storage or reuse.
The traditional CCS setup allows for carbon neutrality on an individual basis. But with the surge in interest and government incentives for pursuing carbon capture, newer initiatives have the loftier goal of carbon negativity.
Direct air capture with carbon storage (DACCS) focuses solely on removing CO2 from the atmosphere, reducing the effects of emissions without creating them. In 2021, Orca opened. Running on geothermal energy, the plant became the world’s largest standalone carbon capture plant, capable of removing 4,000 metric tons of CO2 from the air.
DACCS is an expensive venture, costing around $600–$800 per metric ton of CO2 removed. But environmentalists are optimistic, and the concept could see an enormous boost if Project Bison is successful. The project located in Wyoming will become operational by 2023, making it the first scalable DAC in the country. Planners anticipate it to remove 5 mtpa of CO2 emissions by 2030.
5. The U.S. can store 2.4 trillion metric tons of CO2.
(USGS)
The ability to remove CO2 from the air is crucial, but it becomes meaningless if we don’t have anywhere to store it. Fortunately, there appears to be plenty of space in America alone. The U.S. Geological Survey estimates the nation as having anywhere from 2,400 to 3,700 metric gigatons of CO2 capacity.
The Coastal Plains region has the most potential for CO2 storage. The area spanning from Texas to Georgia can hold up to 2,000 metric gigatons, roughly 65% of the country’s capacity. Alaska and the Rocky Mountain/Northern Great Plains region tie for a distant second place at only 9% each.
Potential storage sites include depleted oil and gas reservoirs and saline formations that can trap CO2 for hundreds of years. Oil and gas fields are valuable due to their two-fold benefits. By injecting CO2, we can permanently remove carbon while using it to extract more resources via enhanced oil recovery (EOR). America has 225 metric gigatons of storage capacity in these sites.
6. CO2-enhanced oil recovery contributes to 350,000 barrels of oil in the U.S. every day.
(Global Energy Institute)
EOR makes carbon capture more economically viable and will play an essential role in keeping CCS attractive to investors. The nation already uses CO2 EOR to produce 350,000 barrels each day, almost 6% of onshore production. According to the Department of Energy, the U.S. can potentially source 137 billion barrels of oil through CO2 EOR systems, which will more than triple the proven reserves.
Interestingly, more than 70% of the CO2 in EOR systems comes from natural sources rather than CCS facilities, meaning there’s no carbon benefit. By expanding CCS, CO2 will become more accessible for EOR, potentially allowing for billions of barrels of recovered oil and over $1 trillion in additional government revenue.

Nature’s Role in Carbon Capture
7. The Earth naturally cycles 100 billion tons of CO2 every year.
(MIT)
Carbon capture is an artificial version of the closed carbon loop that the Earth has always maintained. While humans produce nearly 40 billion tons of CO2 annually, the planet is already churning through 100 billion tons of its emissions.
As ocean and plant life absorbs CO2, natural forces like volcanic explosions, forest fires, and organic decomposition release it. It is a slow, ongoing process of carbon creation and sequestering stretched over millions of years.
While the annual footprint is relatively low compared to nature, humanity’s impact is hurting the cyclical balance. Processes that should take thousands of years, such as fossil fuel recovery and emission, are abbreviated to centuries or even decades. By putting out more than we’re putting back in, we have increased the atmospheric CO2 levels from pre-civilization levels under 300 ppm to 410 ppm today.
8. One tree can remove over 48 pounds of CO2 from the atmosphere each year.
(USDA)
Burning fossil fuels is the crux of the carbon problem. But deforestation exacerbates the issue by taking away a critical natural carbon capture aid.
Over 15 billion trees fall annually due to agriculture, mining, fires, and paper production. With each tree capable of removing around 48 pounds of CO2 each year (1 ton over 40 years), that’s roughly 327 mtpa that we could avoid without affecting emissions.
9. A single whale can sequester 33 tons of CO2 in their lifetime.
(IMF)
Much of the world’s carbon capture relies on the interplay between the world’s largest and smallest creatures. Trees are undoubtedly crucial for many reasons, but the ocean is the true workhorse when it comes to absorbing CO2, relying on microscopic phytoplankton and algae to do most of the absorption as they photosynthesize.
Phytoplankton can absorb 37 billion metric tons of CO2. Krill and larger sea animals feed on the phytoplankton, and whales eat the krill, acquiring the stored carbon. By the end of its life, a whale can contain 33 tons of CO2, which it deposits harmlessly at the bottom of the ocean when it dies.
Whales remove large carbon stores by eating carbon-filled specimens and feed the system through their waste. Through their movements and defecation, whales provide vital nutrients to phytoplankton, encouraging them to thrive. More whales mean more phytoplankton, and with even a 1% increase in their population, those microorganisms can capture several million additional tons of CO2.

Frequently Asked Questions About Carbon Capture
How Do We Transport Captured Carbon?
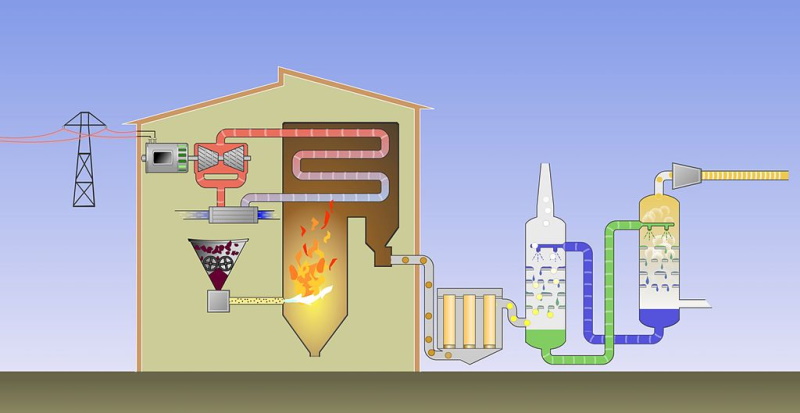
Most CCS facilities use post-combustion carbon capture processes, separating CO2 from burned fuel and compressing/cooling it into a fluid. The facility then transports the high-pressure/low-temperature liquid to a storage site. Pipelines are the most popular transport system, while small amounts may travel via truck or train. The U.S. has approximately 50 pipelines stretching over 4,000 miles and moving 68 mtpa of CO2.
(Global CCS Institute)
Where Do We Store Captured Carbon?
We permanently store CO2 by injecting it over half a mile into underground rock formations. After injection, it becomes trapped in semi-permeable rock, dissolves in water, or mineralizes into a solid form. Common storage sites include:
- Saline aquifers
- Oil and gas reservoirs
- EOR fields
- Coal beds
Deep saline formations are the primary focus for most CCS operations. Operational facilities currently inject a little over 1 mtpa of CO2, but in-development projects seek to increase injection rates to 5 mtpa or higher.
(Global CCS Institute)
How Is Captured Carbon Used?
Alongside EOR, many industries use captured carbon dioxide as a valuable resource in the production of fuel, cement, and other building materials. But as the benefit of CCS and CCUS facilities becomes more apparent, novel applications are under consideration. Consumers may see CO2 in more everyday products, including:
- Shoes and clothes
- Tires
- Plastic cutlery
- Furniture
- Metal substitutes
Climeworks, the DAC innovator behind Orca, also found a market in soft drinks. The company sells CO2 to various bottlers, primarily in Europe, to produce carbonation for beer and sodas.
Conclusion
Carbon capture statistics highlight one side of the global warming fight that often stays unnoticed—the offensive side. Scaling back emissions and changing land use practices are the essence of curbing global warming, but at this stage, we can’t view them as being sufficient. With broader public awareness and heavier investment in carbon capture facilities, we’ll stand a better chance of achieving climate goals that seem to become more unreachable with every passing year.
Featured Image Credit: Jonathan Borba, Unsplash
Contents
