Note: This article’s statistics come from third-party sources and do not represent the opinions of this website.
The UK is one of the largest countries in Europe, with a population of 67.7 million people. The nation enjoys low levels of street crime, violence, and death. As for British roads, they are generally safe and well-regulated. Unfortunately, accidents do happen, some of which lead to fatal outcomes. Today, we want to introduce you to the latest car accident statistics/facts in the UK.
We’ll start by looking at the data from the GB Department of Transport and then focus on the reports by the Police Service of Northern Ireland. Next, we’ll cover general UK statistics. A quick note: after the pandemic, most publications by the British government switched from the regular January–December period to June–June to reflect the new reality. That didn’t apply to NI, though.
Click below to jump ahead:
- Great Britain Car Accident Statistics
- Northern Ireland Car Accident Statistics
- General UK Car Accident Statistics

The 12 Car Accident Statistics and Facts in the UK
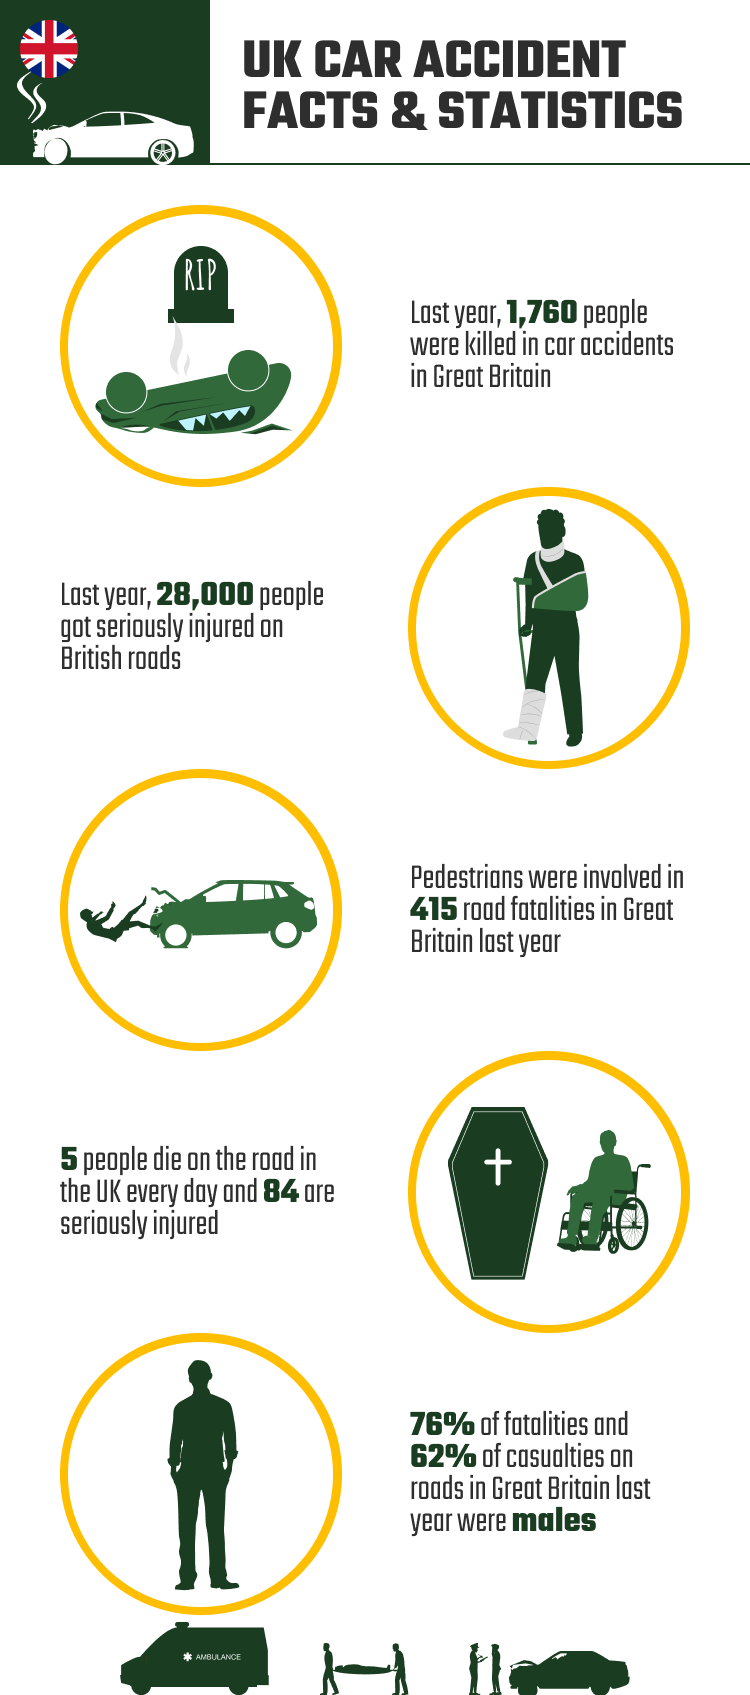
- In 2022, 1,760 people were killed in car accidents in Great Britain, a 26% increase over 2021.
- In 2022, 28,000 people got seriously injured on British roads, a 22% increase over 2021.
- Car occupants account for the highest number of deaths on British roads, reaching 789.
- In 2022, pedestrians were involved in 415 road fatalities in Great Britain.
- In Great Britain, 76% of fatalities and 62% of casualties in 2022 were males.
- In 2021, Northern Ireland had the lowest number of road deaths, with only 50 in total.
- In 2020, NI had the highest road death rate at 30 per million vs 22 in England.
- In 2021, Northern Ireland safety cameras recorded 575 injury collisions, a 7% increase over 2020.
- Overall, in 2021, there were 127,000 casualties reported in the United Kingdom.
- Five people die on the road in the UK every day; 84 are seriously injured.
- In 2020, 38% of road accidents were caused by the driver not looking properly.
- In 2021, the UK had the 5th-lowest road fatality rate in Europe (25 per million).
Great Britain Car Accident Statistics
1. In 2022, 1,760 people were killed in car accidents in Great Britain, a 26% increase over 2021
(Gov.UK)
In the year ending June 2022, there were an estimated 1760 fatal accidents on UK roads. Compared to the previous year’s 1390 fatalities, it was a 26% increase. However, compared to 2019, a pre-COVID year, the death rate went down 4%. But if we put these numbers against the 2012 data, we’ll see that the situation hasn’t really changed much over the decade (the percentage went down by 1.4%).

2. In 2022, 28,000 people got seriously injured on British roads, a 22% increase over 2021
(Gov.UK)
And what about the people that were injured in road collisions? In 2022, cars in Great Britain harmed 28,000 citizens (5.6% less than in 2019; 16.8% less than in 2012). The list includes not only car drivers, but also bike owners, bus drivers, and pedestrians. The bad news is that the statistics for 2021 were much better (22% fewer serious injuries in a year). As for the number of slight injuries in 2022, it reached 107,000 (vs 95,000 in 2021).
3. Car occupants account for the highest number of deaths on British roads, reaching 789
(Gov.UK)
As in any other country, in Great Britain, car drivers/occupants die more often than any other road user type. In the year ending June 2022, accidents took the lives of 789 car occupants. That’s 45% of all the fatalities registered in the country that year. This group also made up 55% of all the casualties (the authorities recorded 75,300 cases).
4. In 2022, pedestrians were involved in 415 road fatalities in Great Britain
(Gov.UK)
While drivers and passengers are in the highest risk group, pedestrians also get into accidents. In 2022, they accounted for 415 lethal collisions (24% of the total number), leaving behind motorcyclists (346), pedal cyclists (99), LGV occupants (51), and more. Compared to 2019, the number of pedestrian deaths dropped by 14.5%.
This was the biggest change in percentage among all the road user types. And if we look at the statistics for road casualties, only 14% were pedestrians (19,000 cases).
5. In Great Britain, 76% of fatalities and 62% of casualties in 2022 were males
(The Guardian)
In the year ending June 2022, male drivers suffered 76% of all fatalities and 62% of all casualties/injuries in Great Britain. The highest number of fatalities (26%) was recorded among drivers aged 17–29. The second-largest group was made up of people aged 70 and over (they accounted for 20% of the fatal accidents). As for the females, the 70+ age group got into most accidents in 2022 (137).

Northern Ireland Car Accident Statistics
6. In 2021, Northern Ireland had the lowest number of road deaths, with only 50 in total
(NI Direct, Police Service of Northern Ireland)
The United Kingdom consists of four nations: England, Wales, Scotland, and, of course, Northern Ireland. In 2021, NISRA reported only 50 fatal accidents on Northern Ireland roads, making it the UK country with the lowest number of registered road deaths. In 2020, car accidents took the lives of 56 people on NI roads, so the number went down by 11% in 2021.
7. In 2020, NI had the highest road death rate at 30 per million vs 22 in England
(NI Direct)
Northern Ireland has a population of 1.88 million people and an area of 14,000 square kilometers. It’s the smallest country in the UK. However, in 2020, NI had a disturbingly high rate of road accidents, despite the lower overall number. It was the leader in the UK with 30 deaths per million. In comparison, there were only 22 road fatalities registered in both England and Wales. Scotland’s rate was 26 deaths per million.
8. In 2021, Northern Ireland safety cameras recorded 575 injury collisions, a 7% increase over 2020
(NISRA)
Overall, the Northern Ireland Road Safety Partnership caught 54,000 violations of traffic rules, including running a red light and exceeding speed limits. And it was the first time in history that the organization managed to make this many detections. That’s largely due to the lockdown measures introduced in the UK in mid-2020 that lasted throughout 2021. The safety cameras also registered 575 injury collisions on Northern Ireland roads.
Compared to a year ago, the number of accidents went up by 7%. The number of speed detections over the same 12 months increased by 7% as well.
General UK Car Accident Statistics
9. Overall, in 2021, there were 127,000 casualties reported in the United Kingdom
(NI Direct)
Around 120,000 estimated road casualties took place in Great Britain; Northern Ireland accounted for 7,200 casualties. Compared to the data from 2020, the casualty rate went down by 9%. And if we put these numbers next to the 2017–2019 data (the pre-COVID years), we’ll see an even bigger reduction in road accidents: 28%. The difference is quite significant, and, again, the lockdown is largely responsible for that.
This statistic shouldn’t come as a surprise, though, because the UK government implemented new, strict driver’s hours rules during the pandemic. Sadly, as we already learned, the death and injury rates went back up in 2022 after the world recovered from the consequences of COVID-19 and drivers were allowed back on the roads.
10. Five people die on the road in the UK every day; 84 are seriously injured
(Brake.org.uk)
Every single day, road accidents take the lives of five people. As for the number of serious injuries, 84 drivers, passengers, and pedestrians are badly hurt in the UK daily. According to the Department of Transport, a person dies or gets severe injuries every 16 minutes. These statistics come from a 10-year report (2012–2021) and represent the average number of deaths and injuries over a decade.
11. In 2020, 38% of road accidents were caused by the driver not looking properly
(Statista)
Human error has always been the #1 cause of accidents, and not only when we are behind the wheel. According to a recent report, 38% of all incidents on UK roads happened because of the driver not looking properly. We are often busy talking to other people in the car or using the phone while driving, and that causes a distraction.
Careless driving and the inability to predict an oncoming vehicle’s path were also among the most common causes of injuries and fatalities on city roads and highways. Surprisingly enough, speeding only accounted for 7% of the accidents in the UK, which is significantly lower than in most countries.

12. In 2021, the UK had the 5th-lowest road fatality rate in Europe (25 per million)
(European Commission, ETSC)
The road death rate in the United Kingdom has been relatively low for many years. And in 2021, Albion was #5 on the list of the countries with the lowest fatality rates in Europe. The UK’s statistics were almost as good as those of Switzerland and Denmark. As for the leaders, Sweden and Malta had a slightly lower rate, with Norway rated as the European nation with the lowest road death rate.
Now, it’s important to mention that over the last decade (2011–2021), the fatality rate in the United Kingdom went down by 18%. However, while that’s a decent result, it’s not that impressive when compared to the 31% reduction for the European Union (the total number of fatal road accidents in the EU went from 28,800 in 2011 to 19,800 in 2021).
Frequently Asked Questions About Motorcycle Accidents
How many licensed cars are there in the UK?
In June 2022, there were 40.7 million registered vehicles in the United Kingdom. Cars made up the largest number, 81.3% (33 million cars). LGVs (large goods vehicles) came in second with 11.3% (4.6 million). HGVs (heavy goods vehicles), bikes, and buses accounted for the rest. The number of automobiles on UK roads has been rising since WWII, except the years 1991 and 2000.
Compared to 2021, the number of new licenses was significantly lower (532,000 vehicles, 19% fewer registrations). At the same time, BEVs (battery electric vehicles) had a major sales boost, topping 2021 by 21%. In total, 51,000 new BEVs were registered in the United Kingdom. To put things into perspective, the number of new diesel cars was significantly lower: 35,000. Here’s a quick look at the number of new cars by type:
- Petrol cars (206,000, 53%)
- Petrol HEV cars (72,000, 18%)
- Battery electric vehicles (51,000, 13%)
- Diesel cars (35,000, 9%)
- Petrol PHEV cars (21,000, 5%)
- Diesel HEV cars (6,000, 2%)
- Diesel PHEV cars (600, 0.2%)
As you can see, petrol cars are still dominating the market, but hybrids and electric cars are gaining on them (Gov.UK).

What’s the most popular car in the United Kingdom?
In 2022, Nissan Qashqai was the best-selling nameplate in the UK. Overall, the Japanese company managed to sell 33,600 units, which landed it the #1 spot on the list. Qashqai is a reasonably priced, practical, and tech-packed crossover SUV with enough legroom and cargo space. Vauxhall Corsa takes second place with 32,100 new registrations. Now, to a US driver, this brand might not be very familiar.
Here, we know it as Buick. Over in the UK, Vauxhall is very popular and favored both by critics and regular folks. For most of the year, Corsa used to be the bestseller, but, at the end of 2022, Qashqai stole the lead. Still, this supermini is a big success in the United Kingdom. Ford Puma comes in at #3 with 31,000 units sold; Kia Sportage occupies the #4 spot with 26,400 new registrations.
And here’s a list of the best-selling brands in the UK (rated by the number of registered cars in millions):
| Ford: | 4.16 M |
| Vauxhall: | 3.16 M |
| Volkswagen: | 2.87 M |
| BMW: | 1.94 M |
| Audi: | 1.79 M |
| Mercedes: | 1.64 M |
| Toyota: | 1.59 M |
| Nissan: | 1.58 M |
| Peugeot: | 1.39 M |
| Honda: | 1.04 M |
Vauxhall is the only UK brand that made the list. The rest are from the US, Germany, Japan, and France (Top Gear, Motorway).
Speed limits in the UK: How fast can you go?
In the United Kingdom, the rules for carriageways (roadways in American English) and motorways (high-speed roads) vary. Thus, for single-carriageways, the speed limit is 60 mph. However, the rules for goods vehicles are different. If you’re carrying 7.5 tonnes, you can’t go over 50 mph (in Scotland, the limit is lower—40 mph). And if you’re driving on a dual-carriageway, you can go as fast as 70 mph.
The same is true for motorways. In built-up areas, you’ll have to drop the speed to 30 mph. Going over that means you’ll be violating the national speed limit. The term built-up area is used to describe urban environments with multiple roofed structures and doesn’t include parks, parking lots, landfills, or ports. And then, there are fixed limits that go from 20 to 50 mph (Safe Driving for Life, CarWow).
You broke the speed limit: What happens next?
In the UK, the minimum penalty for violating national speed limits is 100 pounds. On top of that, you’ll have three penalty points automatically added to your license. So, what’s the deal with these points? When a person has over 12 penalty points, the government might take their license away/disqualify them from driving for as long as three years. Yes, it’s a big deal.
You can, of course, plead not guilty, but if the court doesn’t side with you, the penalty will be more severe. In most cases, they’ll charge a percentage of your income. The maximum fine is 1,000 pounds (2,500 pounds if the accident happened on a motorway) (Gov.UK).
Conclusion
We can’t stress enough how important it is to be safe on the road. Even if your car is in perfect condition, you can never be too careful. The UK is one of the most technologically-advanced countries on the planet, yet the statistics for road injuries and deaths are quite alarming. Drivers and car occupants account for the largest number of fatal accidents.
And, most car owners that get into road accidents in Great Britain are male. So, be vigilant, drive slowly, don’t miss maintenance checks, and do your best not to violate the local speed limits. Otherwise, you might lose your license. As they say, an ounce of prevention is worth a pound of cure!
Featured Image Credit: Monkey Business Images, Shutterstock
Contents