

Note: This article’s statistics come from third-party sources and do not represent the opinions of this website.
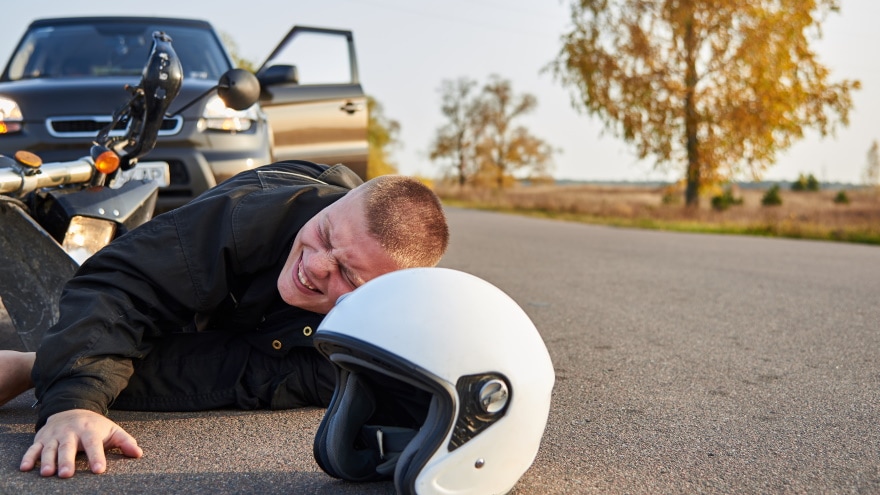
The roads can be a dangerous place with road accidents being one of the leading causes of death for all age groups, but especially for younger people. Despite the risks, however, many of us could not live without cars, motorbikes, and other vehicles. Many individuals would be unable to get to work or school without the use of a motor vehicle. Commerce and industry would grind to a halt.
But, as global populations continue to grow, so too do the number of vehicles. In turn, an increase in vehicle numbers means an increase in the number of fatal and non-fatal accidents that occur each day. While there are dangers for all road users, motorcycles are smaller than other road users and do not afford their riders or passengers the same level of protection as is offered by steel cars. They also lack seatbelts and other safety features that are found in passenger cars.
Click below to jump ahead:
- General Vehicle Usage Statistics
- Car Accidents
- Motorcycle Accidents
- Crash Causes
- Vehicle Safety Statistics

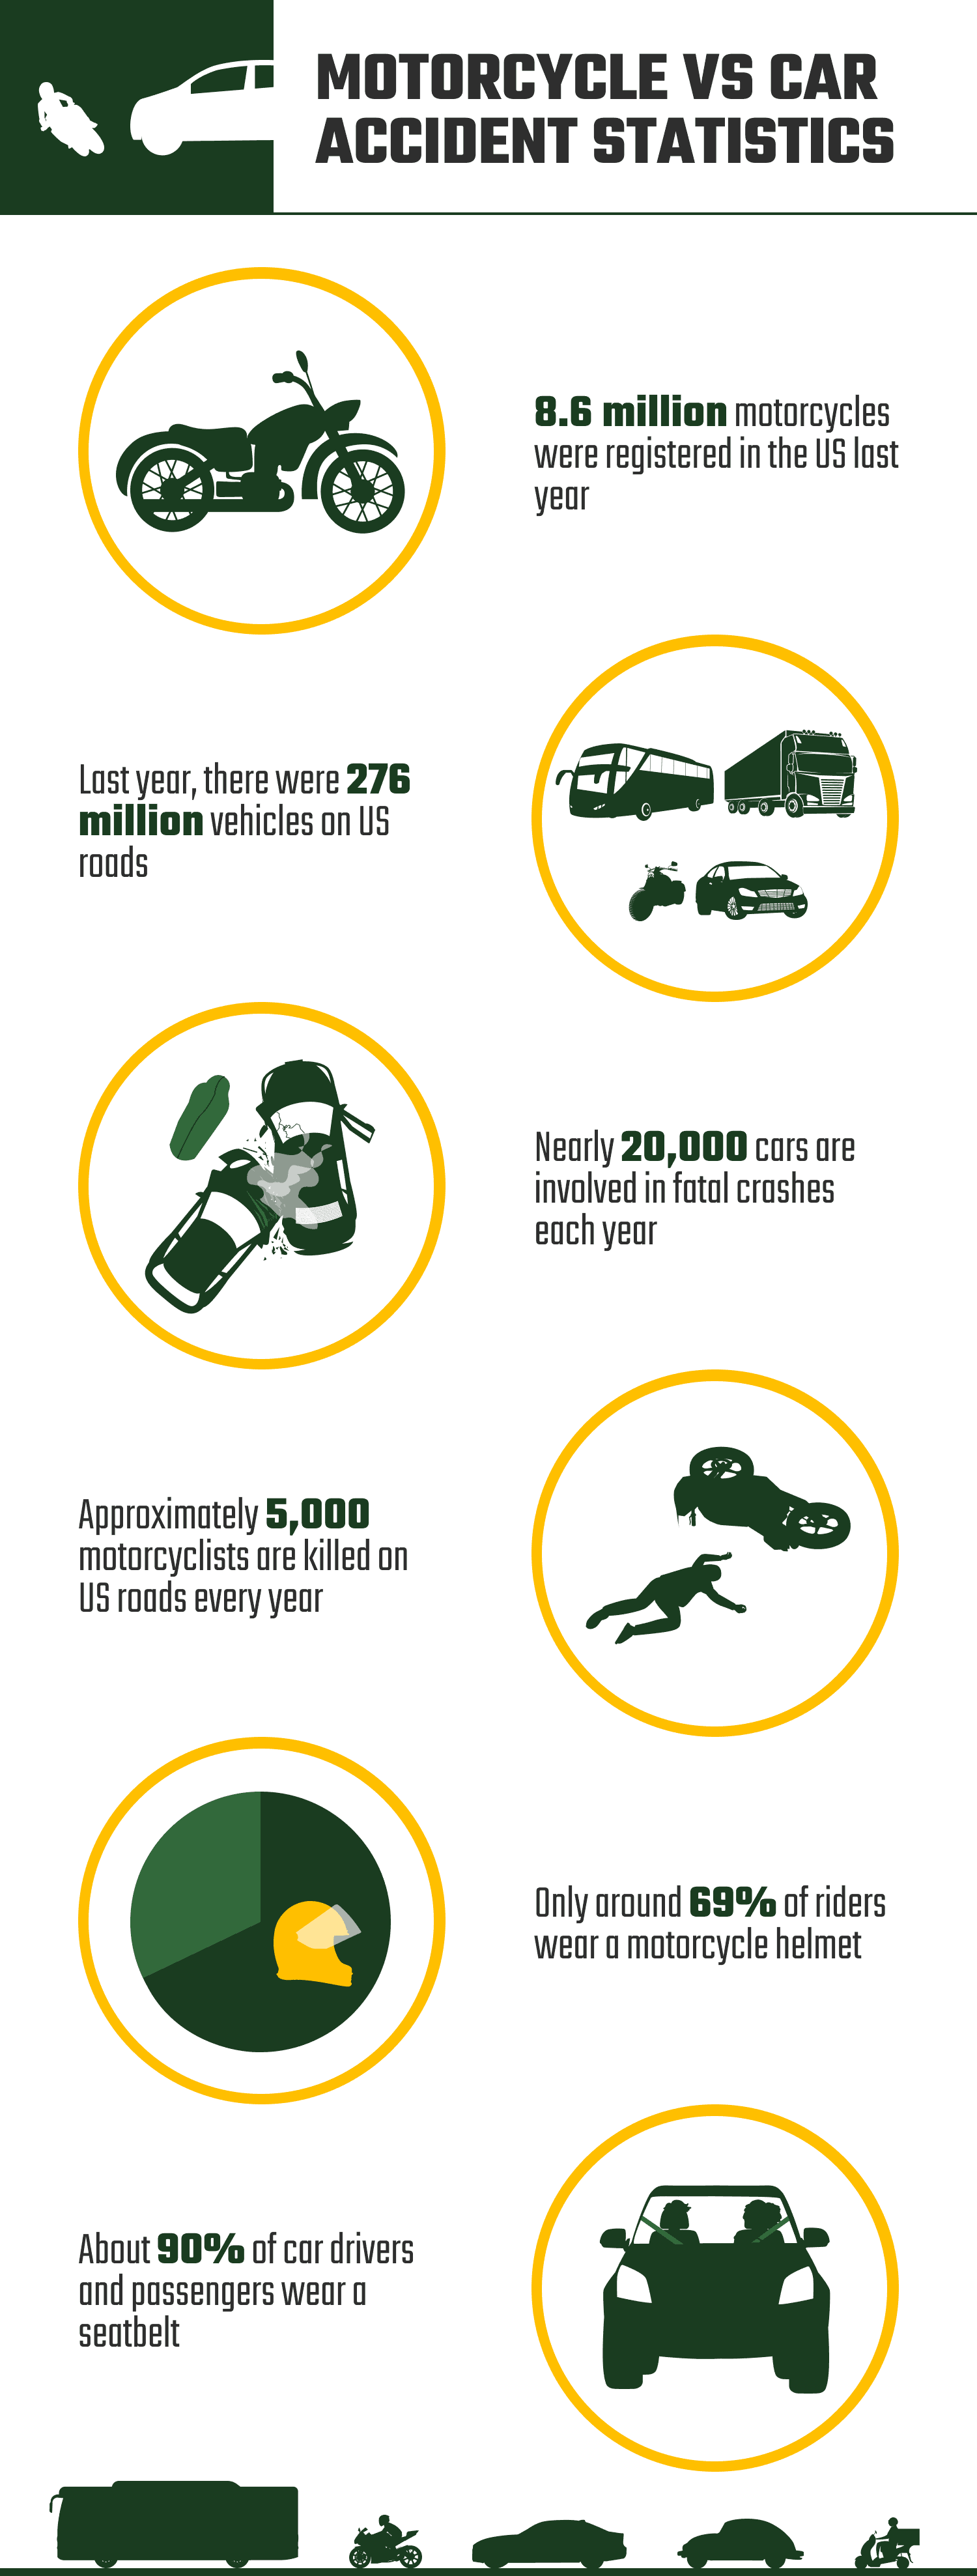
Top 16 Motorcycle vs Car Accident Statistics
- In 2020, there were 276 million vehicles on US roads
- 8.6 million motorcycles were registered in the US in 2021
- Only 3% of vehicles on US roads are motorcycles, and they cover only 0.6% of all vehicle miles
- Road accidents are the leading cause of death for those aged up to 29 years
- Nearly 20,000 cars are involved in fatal crashes each year
- There are 1.11 deaths per 100 million miles travelled by car
- Approximately 5,000 motorcyclists are killed on US roads every year
- There are 26 motorcycle fatalities for every 100 million vehicle miles covered
- 14% of road accident fatalities are motorcyclists
- Florida, California, and Texas have the highest number of motorcycle fatalities
- Speeding is a contributing factor in more than a quarter of all road accidents
- A person is killed every 52 minutes as a result of drunk driving
- 16.1% of registered motorcycles have ABS, compared to 0.2% in 2002
- Half of the motorcycles registered in 2021 were at least 13 years old
- Only 69% of riders wore a motorcycle helmet in 2020
- 90% of car drivers and passengers wore a seatbelt in 2020

General Vehicle Usage Statistics
1. In 2020, there were 276 million vehicles on US roads
(Statista)
The number of vehicles on US roads continues to increase. In 1990, there were just over 190 million registered vehicles. By 2020, this had risen to 275 million: a 45% increase in 30 years. These figures include cars and motorcycles as well as trucks, buses, and other vehicles. 14.5 million new light vehicles were registered in 2020.
2. 8.6 million motorcycles were registered in the US in 2021
(IIHS)
The number of motorcycles on the road has actually seen a sharper increase than those of general light vehicles. In 2021, there were 8.6 million registered motorcycles on the road. This figure was down slightly from 2020, which is likely as a result of the Covid pandemic and its effect on global vehicle registrations but is double that of the 4.3 million motorcycles on the road in 2002. California and Florida have the most registered motorcycles.
3. Only 3% of vehicles on US roads are motorcycles, and they cover only 0.6% of all vehicle miles
(Injury Facts)
These figures mean that just 3% of all vehicles on US roads are motorcycles, while only 0.6% of all vehicle miles covered in the country are covered on motorbikes.
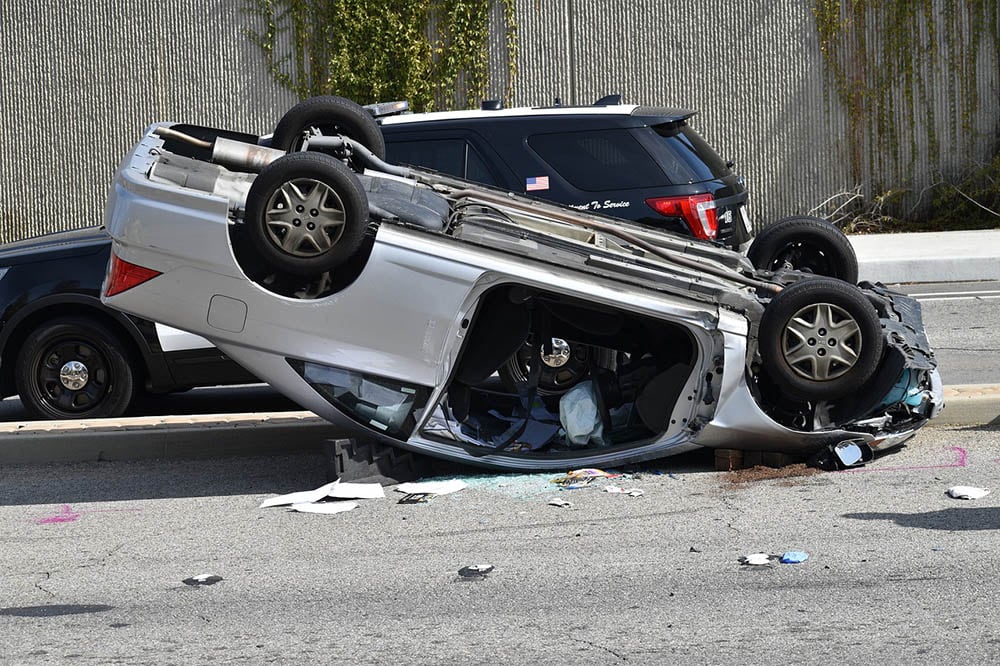
 Car Accidents
 Car Accidents
4. Road accidents are the leading cause of death for those aged up to 29 years
(CDC)
Road traffic accidents are by no means a US-only phenomenon. In fact, it is estimated that 1.35 million people a year are killed in road accidents. These accidents are the 8th leading cause of death in the world and the biggest killer of children and young adults aged up to 29. The CDC estimates that more people die in road crashes than die from AIDS, each year. Road accidents are also the leading cause of death for US citizens living or travelling overseas.

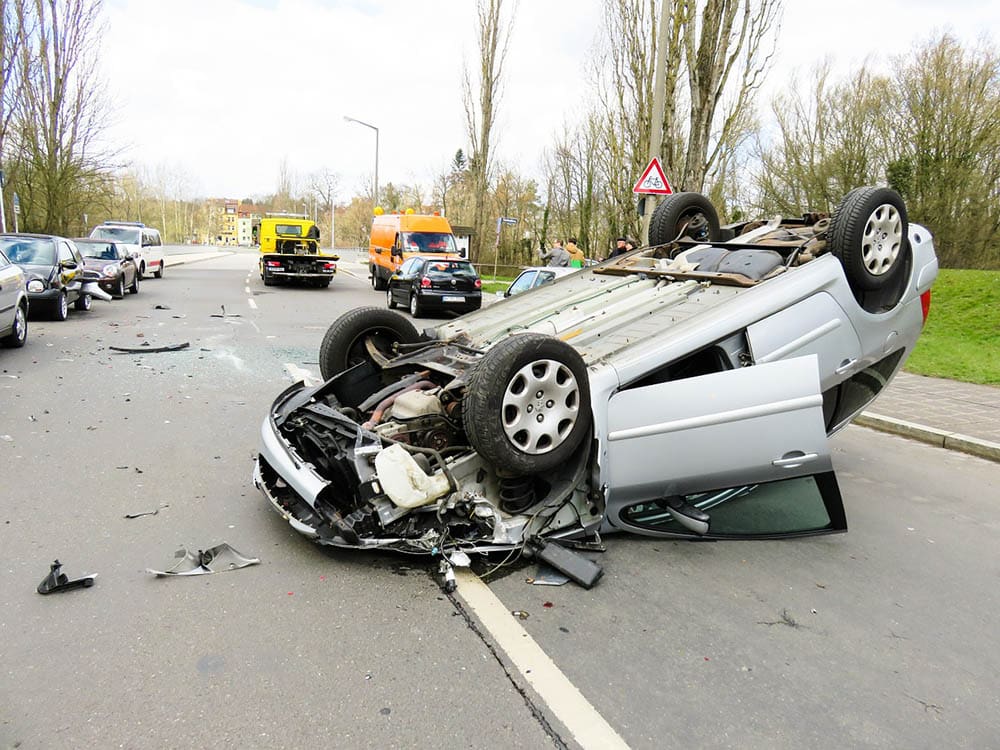
5. Nearly 20,000 cars are involved in fatal crashes each year
(Statista)
Although cars are generally considered safer than motorbikes, there is still a risk of being involved in a fatal accident for drivers and passengers. The number of cars involved in fatal road accidents has dropped significantly since 1995, when there were more than 30,000. In 2019, fewer than 20,000 cars were involved in such accidents, the lowest it has been since 2017 when there were just over 21,000 cars involved in deadly accidents.
6. There are 1.11 deaths per 100 million miles travelled by car
(IIHS)
1.11 drivers and passengers are killed for every 100 million car miles driven and 11 deaths per 100,000 people. South Carolina has the highest rate of 1.73 deaths per 100 million miles, while Massachusetts has the lowest at 0.51 deaths per 100 million miles.
Motorcycle Accidents
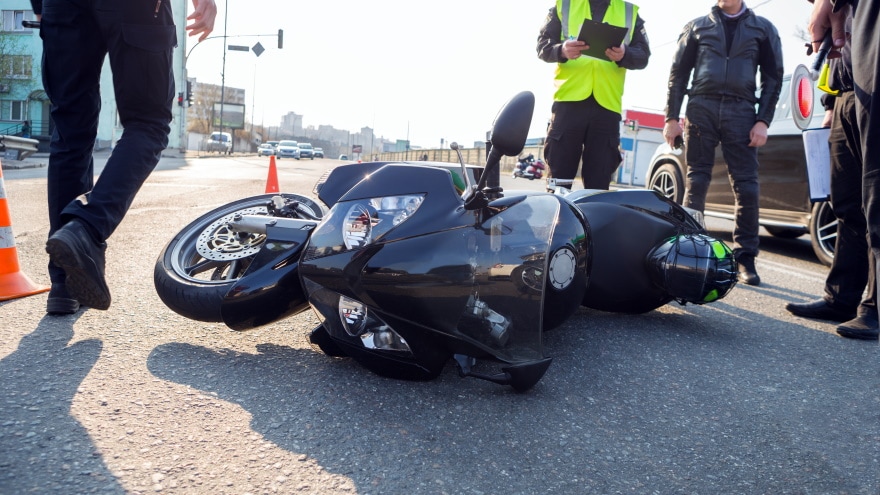
7. Approximately 5,000 motorcyclists are killed on US roads every year
(Statista)
Although numbers have remained reasonably stable since 2006, there are still approximately 5,000 motorcyclists and passengers killed each year in the US. In 1997, there were just 2,160. Although the number of motorcycles on the road has doubled since 2003, the number of fatalities has only increased by 34%. This is likely as a result of improved helmet technology and better motorbike safety features, such as ABS, and may also be as a result of bike awareness campaigns.
8. There are 26 motorcycle fatalities for every 100 million vehicle miles covered
(Statista)
A commonly used metric to determine the danger levels of vehicle types is the number of fatalities per 100 million vehicle miles covered. Generally, car owners use their cars more than motorcycle owners use their bikes, and fatalities per 100 million miles determines the likelihood of an accident and adjusts for the discrepancy in vehicle use. There are 26 motorcycle fatalities for every 100 million miles covered by motorbikes.
9. 14% of road accident fatalities are motorcyclists
(NHTSA)
Although only 3% of all vehicles on US roads are motorbikes, and owners travel less distance on motorbikes than in cars, 14% of all road fatalities are motorcyclists.
10. Florida, California, and Texas have the highest number of motorcycle fatalities
(IIHS)
California is the most populous state in the US, followed by Texas and Florida, so it is not surprising that these three states have the largest number of motorcycle fatalities of all states. In 2019, Florida experienced 591 motorbike fatalities, California 474, and Texas 416 fatalities.
Crash Causes
11. Speeding is a contributing factor in more than a quarter of all road accidents
(NHTSA)
There are many possible causes of car and motorcycle accidents, ranging from driver distraction to mechanical fault. Speeding is one of the most common causes of accidents and has been considered a contributing factor in one third of accidents in the past 20 years. In 2019, speeding contributed to 26% of all road accidents.
As well as driving over the legal speed limit, driving too fast for prevalent road or weather conditions can also increase the risk of accident, and the faster a vehicle is travelling, the greater the likelihood of fatality and serious injury.
12. A person is killed every 52 minutes as a result of drunk driving
(NHTSA)
Drunk driving is another major cause of road fatalities. Alcohol impairs the senses, slows reaction times, and even alters the mood of the driver so that they are more prone to taking risks and driving recklessly. In all states except Utah, it is illegal to drive with a Blood Alcohol Concentration (BAC) of greater than 0.08 grams of alcohol per liter of blood. In Utah, the limit is lower at just 0.05 grams.
28 people die every day because of drunk driving, which is equivalent to one person every 52 minutes. Even drivers with a lower BAC than the legal limit have an increased chance of being involved in a road accident. In 2019, 1,775 people died in accidents where the driver had a level between 0.01 and 0.07 g/dL.
Vehicle Safety Statistics
13. 16.1% of registered motorcycles have ABS, compared to 0.2% in 2002
(IIHS)
Because they only have two wheels, motorbikes are inherently less stable than cars, which have a wheel in each corner to maintain their stability. Any action that further reduces the stability of a motorbike can increase the risk of an accident. Heavy braking can cause the wheel or wheels of a bike to lock up, reducing the amount of control that the rider has.
Modern ABS systems were first introduced in cars in 1978 and the NHTSA made it law that all new cars registered in 2013 or after, must have ABS fitted.
ABS for motorbikes remains behind the curve. It was introduced in 1988 and is mandatory for new motorbikes in the EU. It was also recommended to be made mandatory in the US in 2018, but the law has not yet passed.
However, ABS on motorcycles is increasing in prevalence. Only 0.2% of bikes in 2002 had ABS while in 16.1% of registered bikes in 2021 had this safety feature.
14. Half of the motorcycles registered in 2021 were at least 13 years old
(IIHS)
Although the age of a vehicle does not necessarily directly correlate to accident levels, it does bear some significance. Newer bikes are more likely to have safety features like ABS while older bikes are more prone to mechanical and structural damage. Despite this, bikes are getting older because their increasing popularity means that there are more second-hand bikes on the market.
In 2002, the average age of a registered motorbike was 9 years. In 2021, the average age of a bike was 13.1 years, and half of all registered motorbikes were aged 13 or older.
15. Only 69% of riders wore a motorcycle helmet in 2020
(Statista)
Head injuries are the most likely cause of death in motorbike accidents and experts estimate that an approved helmet is more than 33% effective at preventing fatalities. Most manufacturers recommend that a rider change their helmet every five years, and if you are involved in an accident that causes any exterior damage to the helmet, it is considered time to get a new one.
Despite this, helmets are only legally required for riders of all ages in 18 states. If a rider is aged 21 or over, most states allow them to ride without a helmet. In 2020, 69% of riders wore a helmet. Figures also suggest that 8% of riders were known to be wearing a helmet that was not considered compliant with Department of Transportation guidelines.
See also: Can You Paint a Motorcycle Helmet? What You Need To Know!
16. 90% of car drivers and passengers wore a seatbelt in 2020
(Statista)
Whereas crash helmets are considered the biggest life saver for motorcyclists, seatbelts save the lives of car drivers. All cars built from 1968 onwards have been legally required to have lap and shoulder belts, since 1968. However, it wasn’t really until the 1980s that drivers could be fined for not wearing seatbelts. By 2010, approximately 85% of people wore seatbelts while driving or travelling as a passenger. This number has continued to rise and, in 2020, 90% of drivers and passengers wore a seatbelt.

Frequently Asked Questions About Motorcycle Vs Car Accidents
Do motorcycles have more accidents than cars?
Motorcycles statistically have more accidents than cars. Not only is it more difficult to control a motorbike, due to there being less contact area between motorbike and road compared to the contact area between car and road, but motorbikes are more difficult to see. As a result of a combination of factors, motorcyclists are nearly 30 times more likely to die in an accident than car drivers, based on fatalities per mile.
What Are The Most Common Causes Of Car Accidents?
There are many possible causes of car accidents, but the most common are:
- Driving while distracted – The proliferation of cell phones and other digital devices means that drivers have even more ways to be distracted from the road ahead. Even changing music or chatting to car passengers can cause potentially fatal distractions.
- Driving under the influence – Drunk driving remains one of the most common causes of car accidents. Driving while under the influence of drugs, including some prescription drugs, also impairs judgement and slows reflexes.
- Poor weather – Poor weather conditions limit visibility, increase braking distance, and can lead to skids and other accidents. Drivers are encouraged to reduce speed and be more attentive.
- Reckless driving – Reckless driving means that a person’s driving falls below a reasonable standard. It can include intentional and unintentional actions that increase the likelihood of an accident. Road rage is also included as a form of a reckless driving.
- Speeding – Speeding not only increases the likelihood of an accident but it reduces the time a driver has to react to a potential hazard, and it increases the likely severity of injuries sustained in an accident.
What Are The Most Common Causes Of Motorcycle Accidents?
Motorbike accidents are caused by many of the same factors as car accidents including speeding and riding under the influence. Another major cause of motorbike accidents is a lack of driver awareness. This includes car drivers impeaching on a motorcyclist’s right of way.
What Is The Most Common Injury In A Motorcycle Accident?
Head and brain injuries are the most common and most serious injuries sustained in motorcycle accidents. Wearing a helmet can help reduce the severity of these injuries and helmets have been shown to reduce the chances of fatality by more than 33%.
What Percentage Of Motorcycle Riders Get In Accidents?
Based on the number of motorcycle accidents and the number of registered motorcyclists on US roads, 1% of riders get into accidents each year. However, this figure doesn’t consider minor accidents and those that are not reported, so the real figure is likely to be higher than this. (Kerley Schaffer)
See Also:

Conclusion
Motorbikes and cars are considered essential for many people, as a means of getting to and from work, school, and other locations. However, with an increased number of road users comes an increased risk of accidents. Car drivers and passengers, as well as motorcyclists, are in some danger of being involved in accidents, and fatalities occur every day on US roads. Unfortunately, motorcyclists have less protection and are up to 30 times more likely to be involved in a fatal crash than car users.
Featured Image Credit: Dmitry Surov, Shutterstock
Contents
