
Note: This article’s statistics come from third-party sources and do not represent the opinions of this website.
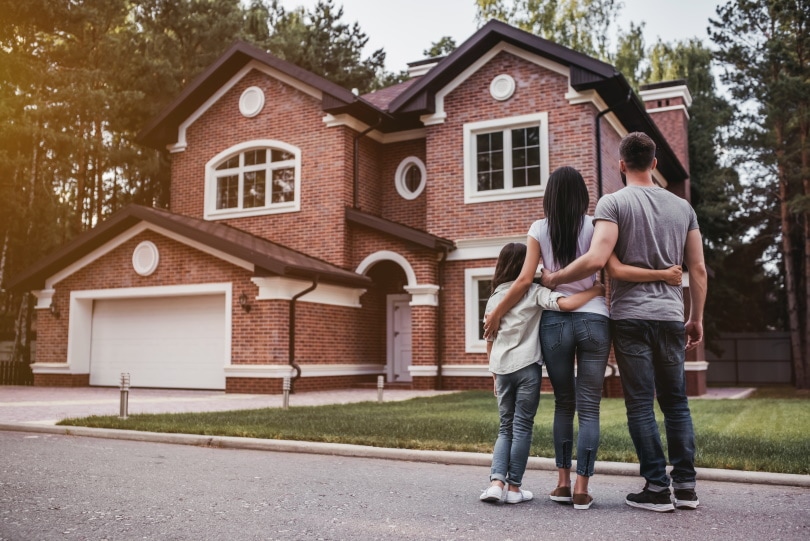
Owning a home is a big part of the American Dream. It is a place where you can live, raise your children, and pass it down when the time comes. Real estate is also a great investment with excellent resale value. The bad news is—houses aren’t very affordable these days. While the percentage of homeowners in the States has been growing steadily since the 70s, it takes most Americans 20–30 years to pay off their mortgage.
Today, we’ll check the most insightful facts about home ownership, backed by statistics from the Census, the National Association of Realtors, Zillow, and other sources.
Click below to jump ahead:
- US Home Ownership Statistics and Facts
- Race and Age Home Ownership Statistics and Facts
- General Home Ownership Statistics and Facts

The 12 Home Ownership Statistics
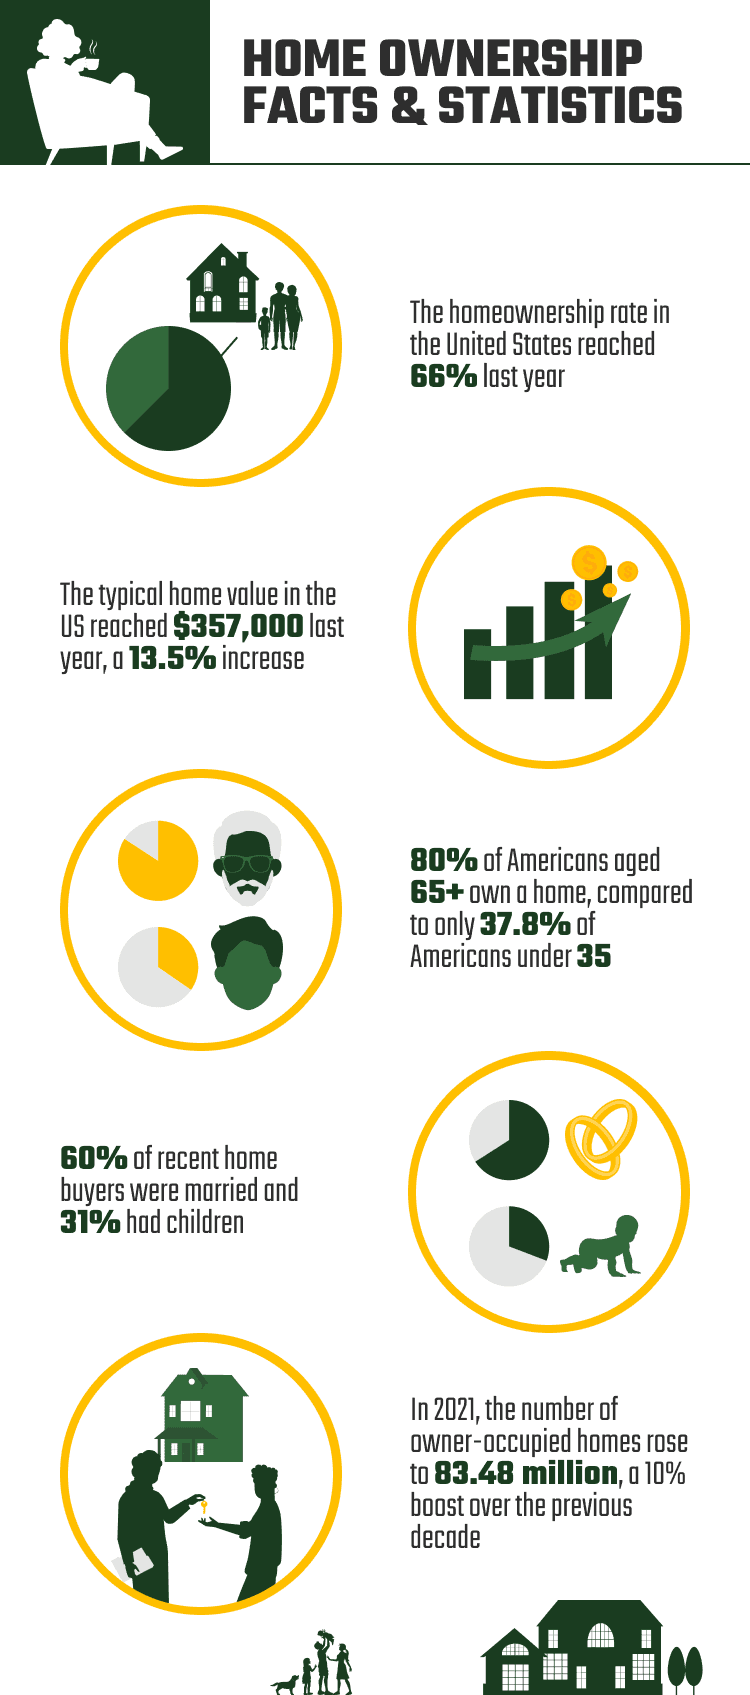
- In 2022, the homeownership rate in the United States reached 66%.
- In 2021, the number of owner-occupied homes rose to 83.48 million, a 10% boost over 2011.
- The typical home value in the US reached $357,000 in 2022, a 13.5% increase compared to 2021.
- In Q3 2022, single-family home prices in metro areas rose 8.6% compared to Q3 2021.
- In October 2022, 632,000 new single-family houses were sold, a 5.8% decrease versus October 2021.
- Household debt rose to $16.5 trillion in Q3 2022; mortgage debt accounted for $11.67 trillion.
- 80% of Americans aged 65+ own a home, compared to only 37.8% under-35 Americans.
- Black Americans have the lowest rate of homeownership in the US (42.2%).
- Gen Z makes up 2% of the total number of home buyers and sellers in the US.
- In 2022, 60% of recent home buyers were married and 31% had children.
- Romania has the highest rate of homeownership in the world (96%).
- Denmark has the lowest mortgage interest rate in Europe (0.9%).
US Home Ownership Statistics and Facts
1. In 2022, the homeownership rate in the United States reached 66%.
(Census.Gov, Statista)
According to the United States Census Bureau, in Q3 2022, the homeownership rate hit 66%. Compared to 2021, it was a 0.6% increase. Now, if we compare these numbers to 1990, we’ll see that the rate hasn’t changed much. Back then, it was 64.1%. As for the peak, the country managed to achieve a homeownership rate of 69.2% in 2004.
Unfortunately, the 2007–2008 Financial Crisis put a stop to the steady growth. The housing market went into turmoil and plummeted to 63.7% in 2016. Thankfully, things changed for the better after that, and for the last six years, the market has been enjoying slow yet stable growth.
2. In 2021, the number of owner-occupied homes rose to 83.48 million, a 10% boost over 2011.
(Statista)
Despite the fundamental challenges that the US economy has been going through these past few decades, the number of owner-occupied housing units reached an all-time high in 2021. We’re talking about 83.5 million homes that are owned and lived in by the same people. Along with that, the number of rented houses in the States in 2021 went up a little over 44 million.
Going back to owner-occupied homes, it’s important to note that the data hasn’t changed dramatically over the last 10 years. True, compared to 2011’s 76 million homes, it’s a 10% boost. Still, the percentage increase isn’t very rapid. But if we check the 1975 data, we’ll see that only 46.9 million homes were owner-occupied.
3. The typical home value in the US reached $357,000 in 2022, a 13.5% increase compared to 2021.
(Zillow, Census.Gov, World Population Review, FRED)
A recent report by Zillow revealed the typical home value in the States: $357,000, a 13.5% boost over 2021. However, the median sales price and the average sales price were much higher ($493,000 and $544,000, respectively). In 2022, Hawaii was the most expensive state in terms of average home prices ($849,000), followed by California ($760,000), DC ($701,000), and Washington ($595,000).
If you’re on a low budget, consider moving to West Virginia because they’ve got some of the cheapest real estate over there (only $123,000). Mississippi, Arkansas, and Oklahoma are also quite affordable. The most expensive homes are in the Northeast (a little over one million dollars), while the Midwest enjoys the lowest prices ($426,000).

4. In Q3 2022, single-family home prices in metro areas rose 8.6% compared to Q3 2021.
(NAR.Realtor)
In the third quarter of 2022, 98% of metro areas in America saw a minor increase in housing prices. We’re talking about single-family, existing homes here. Compared to the data from 12 months ago, the prices rose by 8.6%, reaching $398,000. The mortgage payments, in turn, went through the roof (+50%), reaching $1,800.
5. In October 2022, 632,000 new single-family houses were sold, a 5.8% decrease versus October 2021.
(Census.Gov, Statista)
In 2021, realtors across the country managed to sell 6.12 million single-family homes. That was a big improvement over 2020 (5.64 million). The numbers are predicted to go down a bit in 2022, though, reaching only 5.95 million houses sold. On the bright side, the forecasts for 2023 are much better and the numbers are predicted to go back to steady growth.
And if we break 2022 into months, we’ll see that a total of 632,000 new single-family houses were sold in October. This is a 7.5% boost vs. September 2022. Yet, compared to last year, the numbers are a bit low (671,000 sold in October 2021). The highest results were achieved in January 2022 (831,000 units sold).
6. Household debt rose to $16.5 trillion in Q3 2022; mortgage debt accounted for $11.67 trillion.
(NY Fed Reserve Bank)
While the household debt growth over 2022 was relatively low (2.2% or $351 billion), the total debt of $16.5 trillion is quite alarming. Mortgage balances make up most of the debt, coming in at $11.67 trillion. More importantly, in 12 months, that number grew by $282 billion—a 15% year-over-year difference. And this is the biggest mortgage debt increase in more than two decades.
Race and Age Home Ownership Statistics and Facts
7. 80% of Americans aged 65+ own a home, compared to only 37.8% under-35 Americans.
(Statista)
Almost 80% of seniors (people aged 65 and older) in America own a house. The percentage of homeowners in the under-35 age group is not nearly as impressive: only 37.8%, which is more than two times lower compared to the 65+ group. That said, a recent survey by Statista has revealed that more than one-third of adults living in the States are more confident in their ability to purchase a house in 2021 compared to 2022.
Millennials were leading the charge, with 45% of the population feeling good about their prospects for the future.

8. Black Americans have the lowest rate of homeownership in the US (42.2%).
(Statista)
Despite the efforts of the current administration to provide equal opportunities to different ethnic groups living in the US, the gap is still there, and it’s rather big. For example, White Americans enjoy the highest homeownership rate in the country, 74.1%. Asians have the second-highest percentage, 59.9%, with American Indians and Alaskan Natives coming in at #3 with 55.1%.
Hispanics and Black Americans have the lowest ownership rates (48.4% and 44.2%, respectively).
9. Gen Z makes up 2% of the total number of home buyers and sellers in the US.
(NAR. Realtor)
Millennials (aged 23–41) account for the highest share of homebuyers in the States (43%), while Baby Boomers (57–75 years old) sell more (42%). As for Gen Zers (aged 18–22), they only make up 2% of sellers and buyers in the country, which is the lowest percentage among all age groups. And in 2022, first-time buyers accounted for 34% of all home buyers in the country, and that’s a 31% increase over 2021.

10. In 2022, 60% of recent home buyers were married and 31% had children.
(NAR. Realtor)
The vast majority of recent real estate buyers in America were married couples (60%). Single males made up 9%; single females accounted for 19%. But, 31% of the total number of buyers had children. Next, 89% of buyers identified as heterosexual; 82% were white/Caucasian. Lastly, the highest percentage of buyers—31%—had a bachelor’s degree.
General Home Ownership Statistics and Facts
11. Romania has the highest rate of homeownership in the world (96%).
(Eurostat)
In the EU, most people live in their own homes (70%). Romania is the undisputed leader: 96% of Romanian citizens own a house. Slovakia is a close second with 92.3%. Croatia and Hungary share the third place with 91.3% owners vs. 8.7% renters. On the other end of the spectrum, we have Switzerland. The owner/tenant share over there is 42.3%/57.7%.

12. Denmark has the lowest mortgage interest rate in Europe (0.9%).
(Statista, Trading Economics)
And what about the interest rates in the EU, you might ask? The country with the lowest mortgage interest rates in the European Union is Denmark. The rate is 0.9%, and that’s a 25% increase over 2021 (0.72%). Portugal comes in at #2 with 1.2%, followed by France with 1.27%. During the coronavirus pandemic, interest rates in the EU collapsed (just like in most parts of the world).
This was the result of the local governments trying to tackle the consequences of COVID-19. That had little effect on the Nordic countries, however, because they’ve always had relatively low mortgage interest rates thanks to a stable financial system, among other things. Right now, Moldova has the highest rates in the EU (19.5%), followed by Hungary (12.5%). The inflation rates there are off the roof, too.
Frequently Asked Questions
Assessed Value vs Market Price: What’s the Difference?
If this is your first time trying to buy a house, all these terms can be a bit confusing. The same is true if you’re planning on selling real estate and want to figure out the right price for it. So, here’s the deal: in the States, homes are valued in different ways, and that’s why the prices vary depending on the evaluation method. The most common values are the asserted and market value.
The asserted value is what the local government uses for taxation (the lower it is, the lower the taxes on that house will be). As for the market price, it’s almost always higher than the asserted value. What’s the definition of market value, then? In simple terms, it’s the price that the seller is happy to accept and the buyer is ready to pay. It’s a more accurate representation of that house’s worth at the current moment (Forbes, Realtor).

What’s the Average Down Payment in the US?
This greatly depends on the mortgage/loan type that you’re opting for.
- If you’re a Military Service Veteran, you’ll be eligible for a VA loan with a minimum down payment of 0%. Surviving spouses and active military servicemen and servicewomen can take advantage of this option as well. The VA loan is the best offer on the table, but it’s not available to everyone.
- Good news: you don’t have to be in the Army to get a house without putting any money down. Instead, you can go with a USDA loan. It’s financed by the government and encourages US citizens to buy real estate in suburban areas. Not all mortgage loan providers support USDA loans, however.
- Next, we have the FHA loan with a minimum required down payment of 3.5%, which is still very low. There’s a catch, though: in most states, 420,000 is the maximum coverage you can rely on (or up to 970,000 in certain expensive areas). Check this before signing the papers.
- Conventional loans are one of the most popular picks among Americans, as they usually come with a fixed rate of 5% (or as low as 3%) and a limit of $647K. These loans are much easier to get, too, especially if you have a good credit score and little to no debt.
- Are you looking for big loads (up to $3 million)? Then Jumbo loans will be worth your attention. Jumbo mortgage is a unique financing option that’s not affected by the limits set by the US Federal Housing Agency and has a minimum down payment of 10%. Again, the FHA limit is $647K.
- Finally, we have adjustable-rate mortgages, also known as ARM loans. Expect to pay at least 10% as a down payment. There are no strict limits here: everything depends on the region. The interest rates aren’t fixed, either, and can change depending on the index (Rocket Mortgage, NAR).

Putting Down 20% on the House: Is It Worth It?
Most mortgage lenders want their clients to make a 20% down payment. Why is that, though, and what are the benefits for the potential buyers? First, the more you pay upfront, the less you’ll have to pay later—that’s the obvious part. Another big pro has to do with the interest rates: folks that pay 20% in advance get better interest rates.
By putting more money down, you’re letting the lender know that your intentions are serious and you’re planning on paying the rest of the amount. More importantly, you’re taking some of the “financial pressure” away from them. Lower-than-average mortgage interest rates are their way of saying thank you to the clients. (US Bank)
What’s the Average Rent Price in the States?
In October 2022, rents in the United States saw a 7.8% increase, although the prices did go down compared to September and August. The highest year-over-year spike was registered in Florida (23%), South Dakota (21.4%), and Delaware (almost 19%). In contrast, the prices in four American states—Nevada, Wisconsin, Massachusetts, and Idaho—actually went down (by 0.4–3.1%).
And if we look at metro areas, Oklahoma City had the biggest YoY peak in prices (31.7%), despite the low median rent ($1,300). As for the average rent price, it’s around $2,000. To put things into perspective: in October 2019, the median rate was $1,600 (23% lower compared to 2022). Overall, in 2022, 44 million homes were rented, but the rental vacancy rate of 5.8% was the lowest since the 1980s. (Rent.Com, Harvard)
- You might also like: How Do Rent-To-Own Homes Work? Everything You Need to Know!
Conclusion
With the Recession taking its toll on the economy, it’s getting harder to buy a house in the US (and around the world). The government is doing its fair share with stimulus checks and affordable housing programs, but still, for the average citizen, housing prices are just a bit too high. The gigantic household debt in the States is a clear example of that.
On the bright side, the number of home-occupied houses reached an all-time high in 2021, and the vast majority of Americans do own a home. However, there’s still a large homeownership gap between different ages and races. Here’s hoping world leaders will be able to fix this problem in the near future and bring housing prices down!
See also: Can You Be a First-Time Home Buyer Twice? The Surprising Answer!
Featured Image Credit: kurhan, Shutterstock
Contents